This guide explains how to integrate Scalefusion with Splunk Enterprise to collect and monitor Scalefusion events, including Dashboard Access, Account Activity, Device Management, and Device Activity. Using a custom Splunk add-on, you can configure event collection at regular intervals and send the data to your Splunk index for monitoring and analysis.
Before you begin
You will need:
A Linux machine (Debian-based, e.g. Ubuntu) for Splunk. Setup is easiest on Linux.
A free Splunk.com account (trial is fine).
Admin access to your Scalefusion Dashboard.
Keep your credentials somewhere safe: Splunk.com login, Splunk admin username/password (created during install), and your Scalefusion API Key and Secret.
Step 1: Install Splunk Enterprise
Create a trial account at splunk.com and note your username and password.
Download and install Splunk Enterprise from splunk.com/en_us/download/splunk-enterprise.
During setup, set an admin username and password and note them down.
Confirm Splunk is working:
curl -k -u <admin_username>:<admin_password> https://localhost:8089/services/server/info
You should see server details returned.
Handy Splunk commands
Step 2: Install Splunk Add-on Builder
Log in to the Splunk Web UI.
In the left Apps panel, click Find more apps.
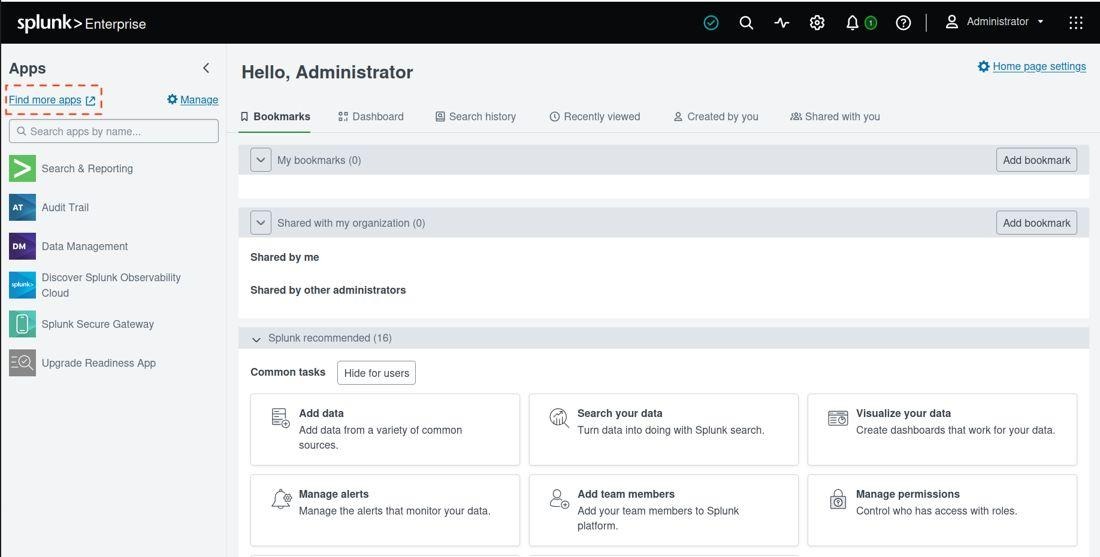
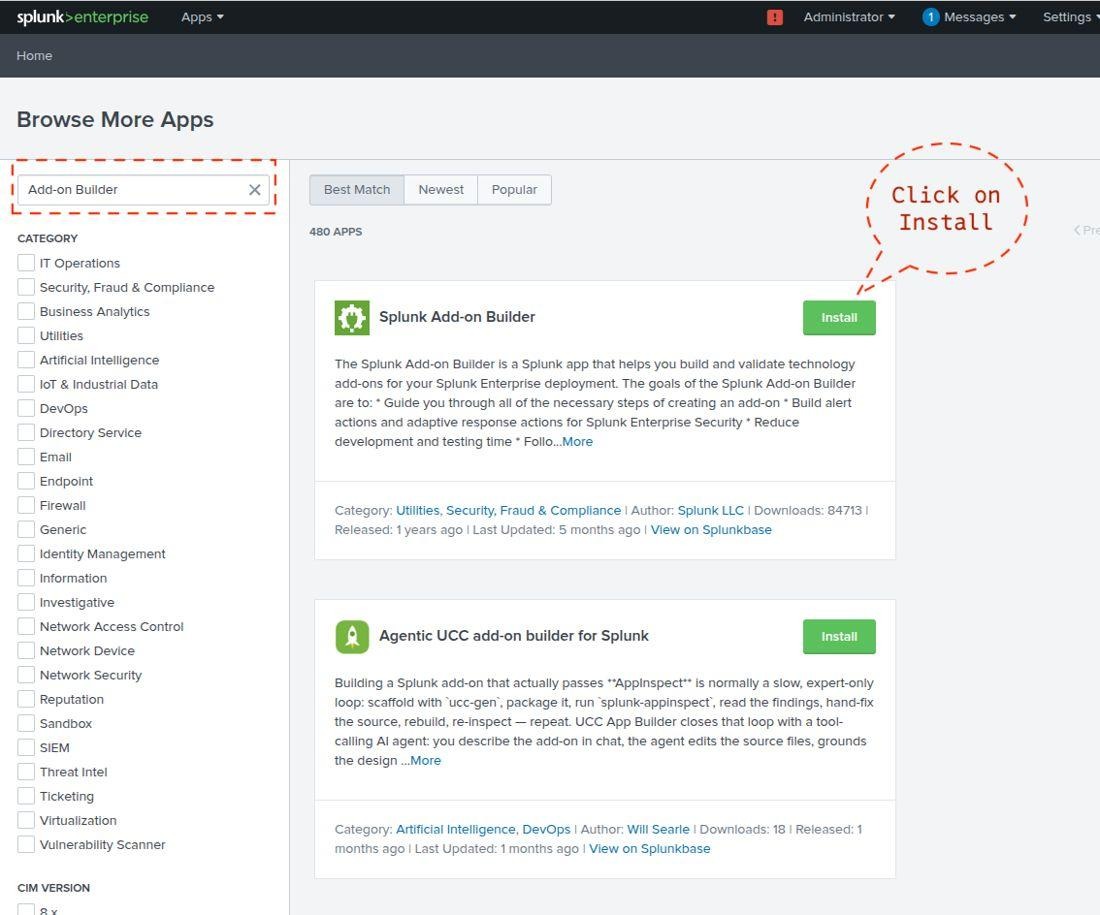
Search for Add-on Builder, then click Install next to Splunk Add-on Builder (by Splunk LLC).
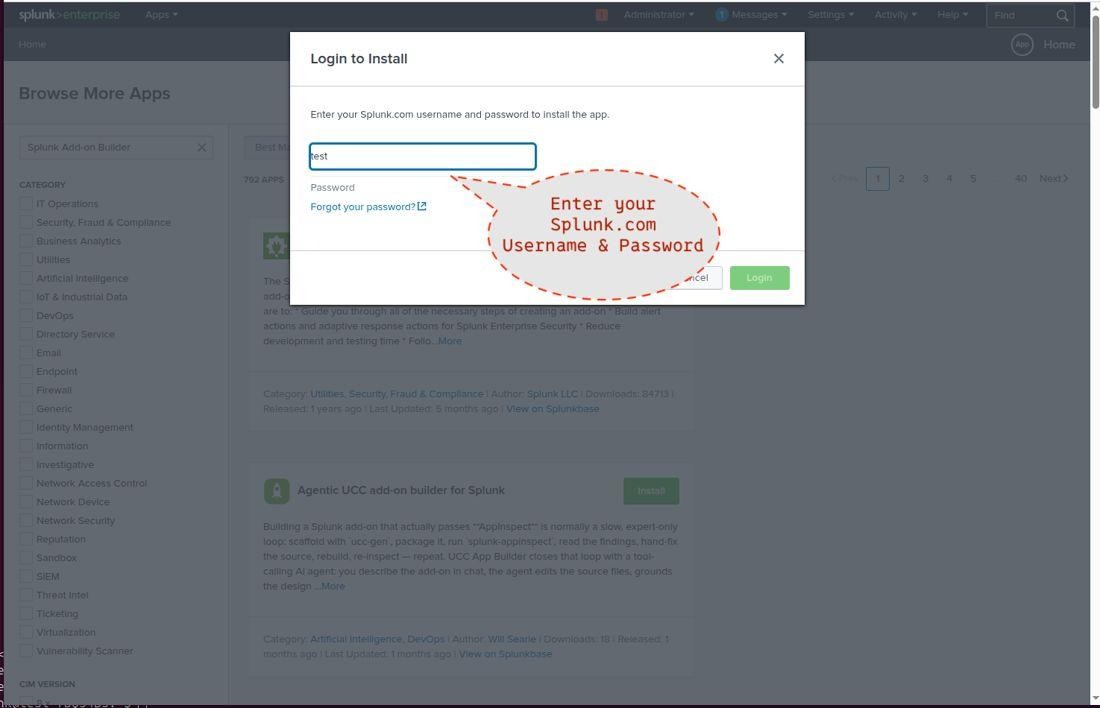
Enter your Splunk.com username and password when prompted.
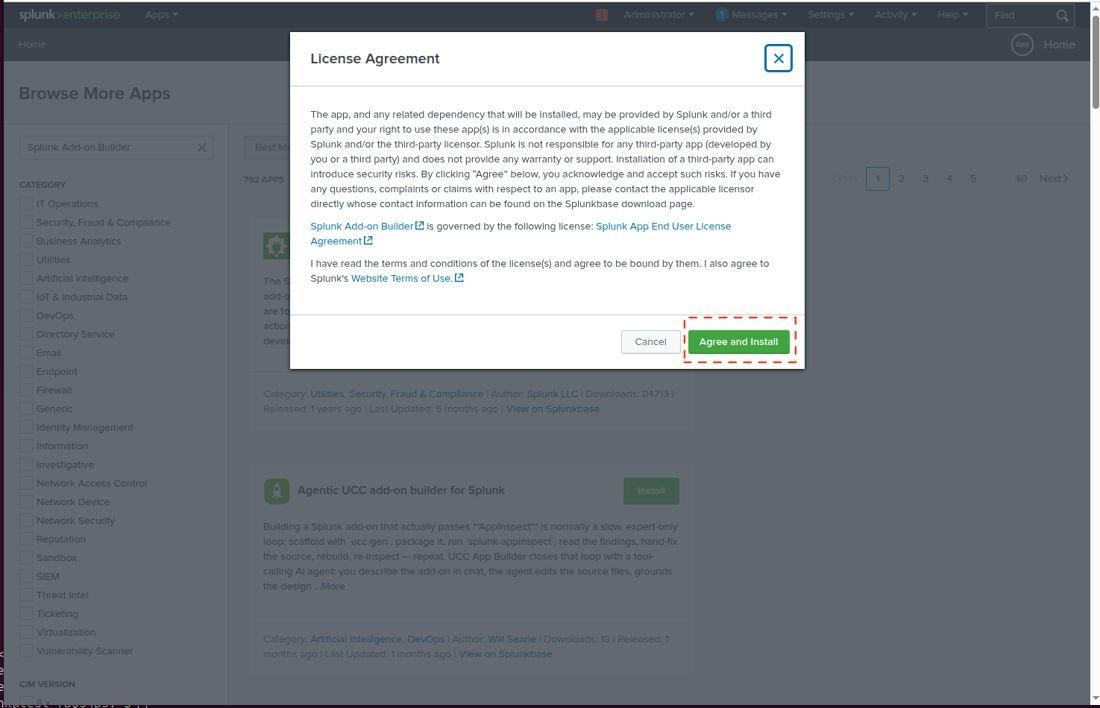
Accept the license and click Agree and Install.
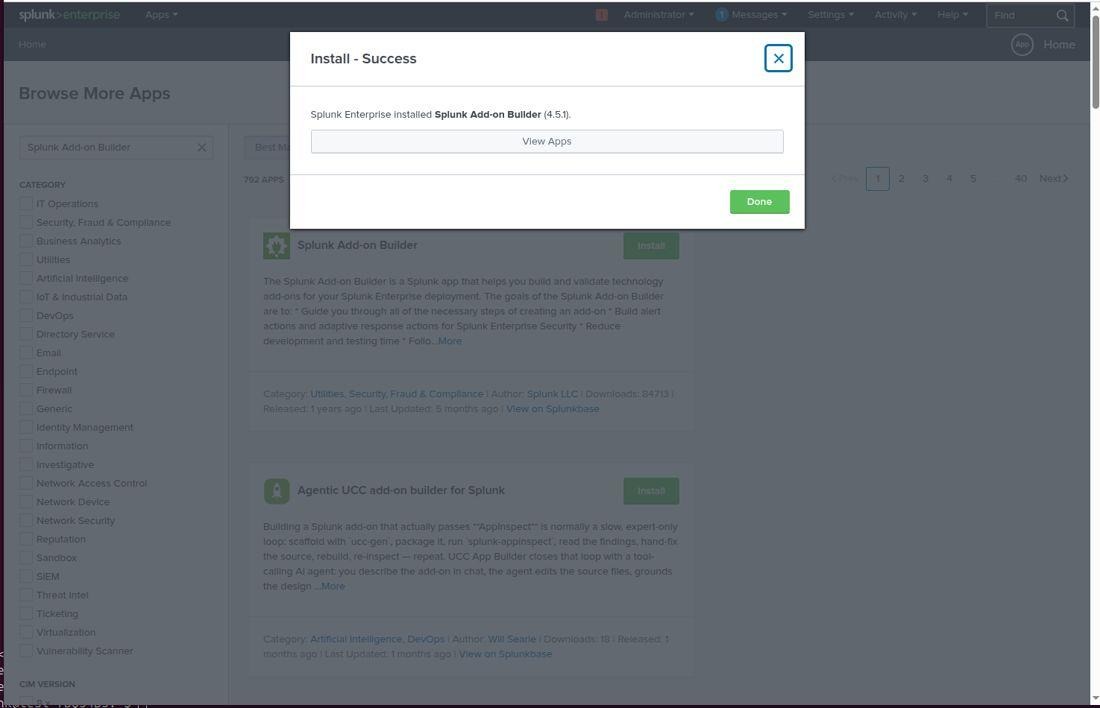
When you see Install – Success, click Done.
Step 3: Create the Scalefusion add-on
A. Create the add-on
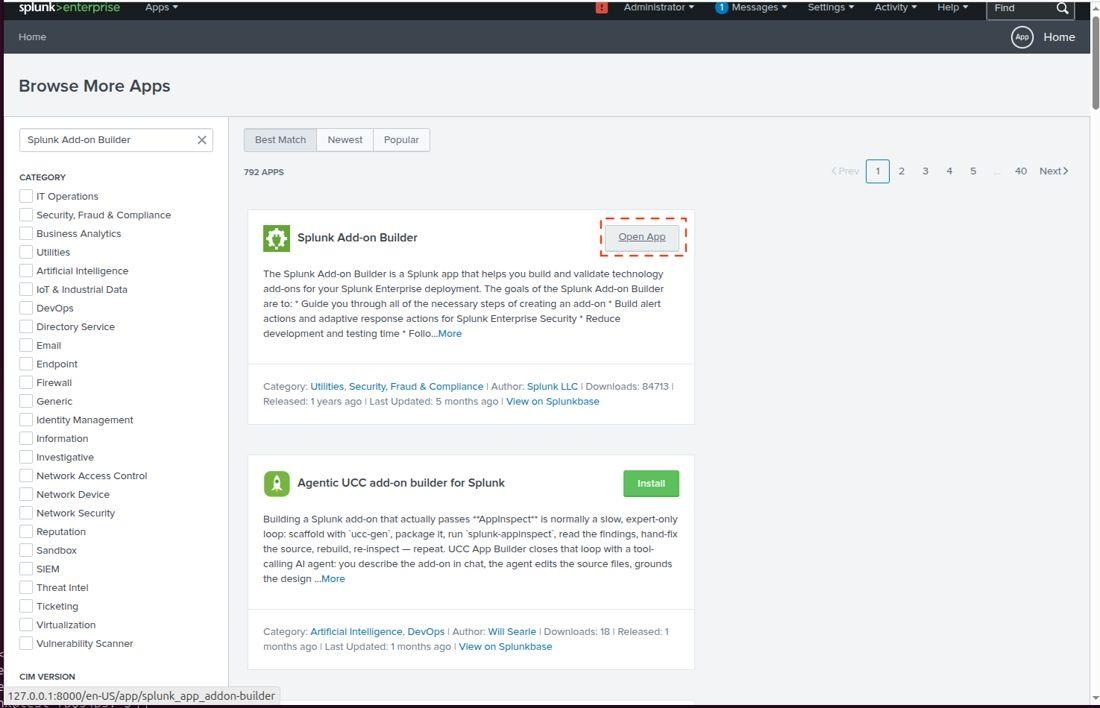
Open Splunk Add-on Builder (Apps list → Splunk Add-on Builder → Open App).
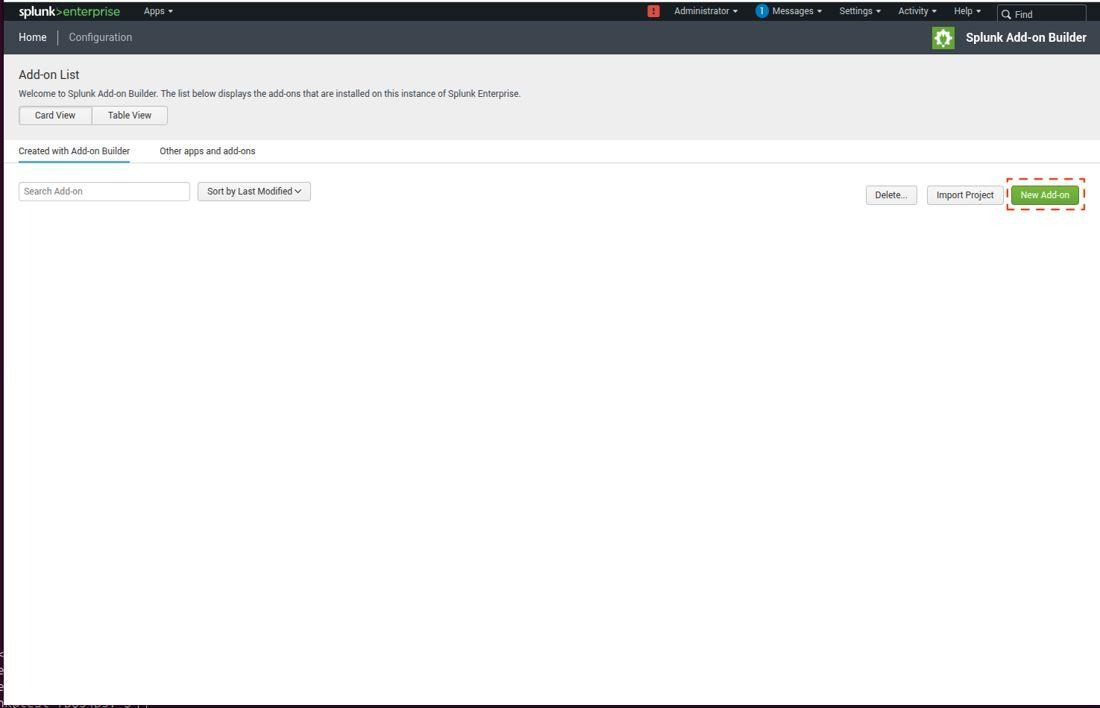
Click New Add-on.
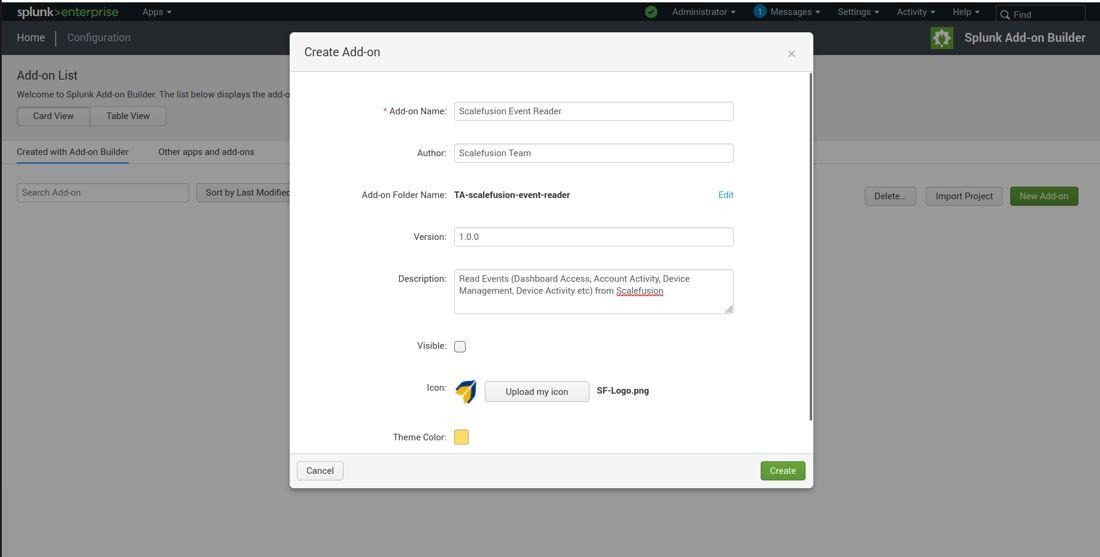
Fill in the details and click Create:
On the add-on home page, click Configure Data Collection.
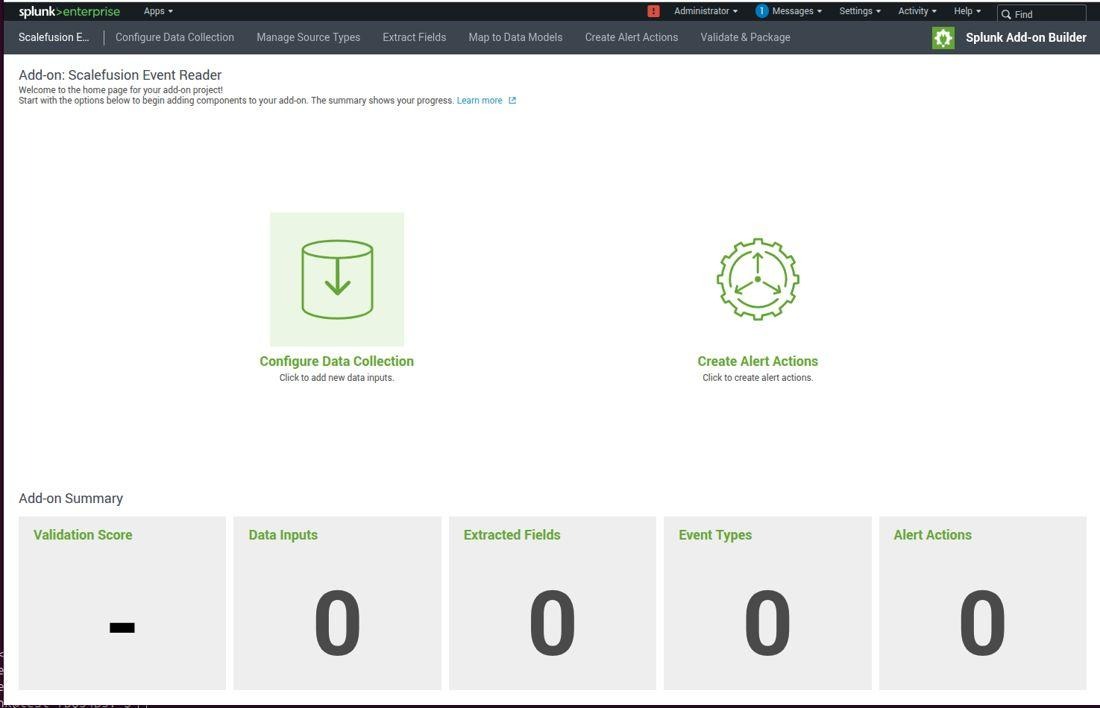
B. Add a data input
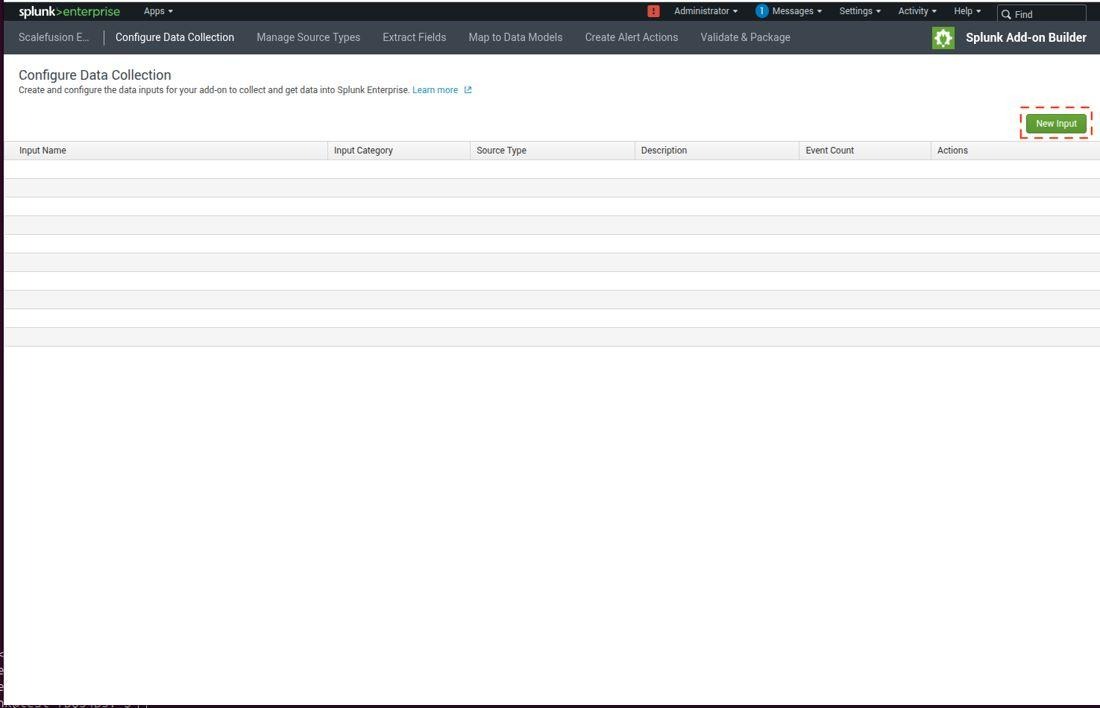
Click New Input.
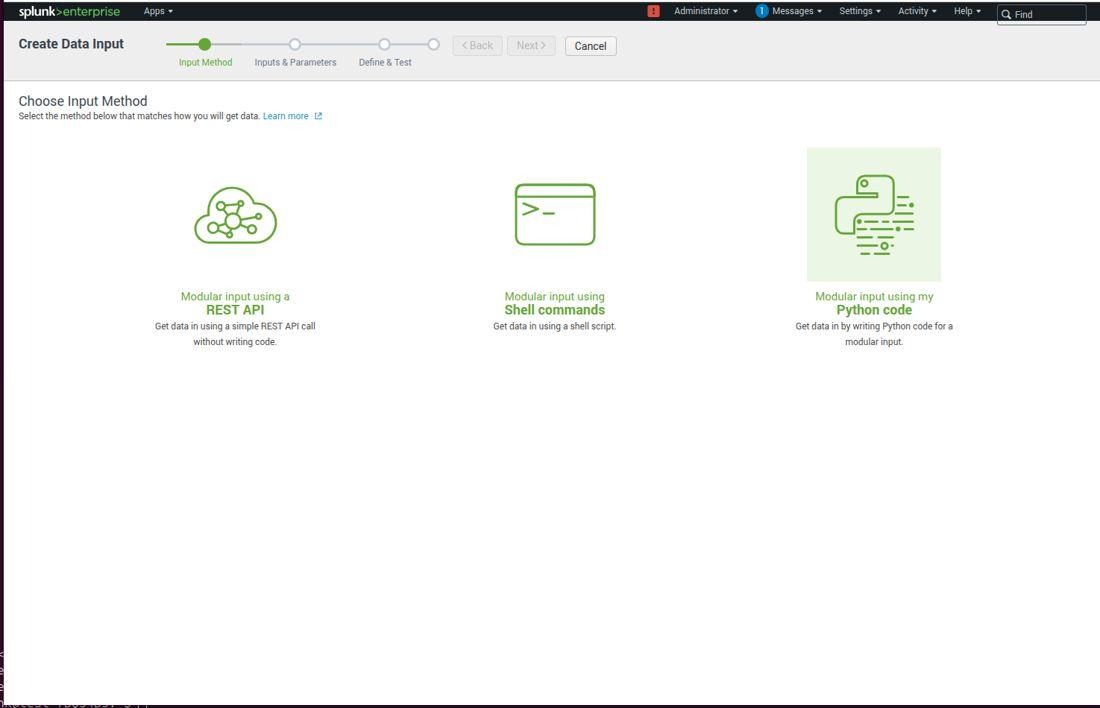
Choose Modular input using my Python code.
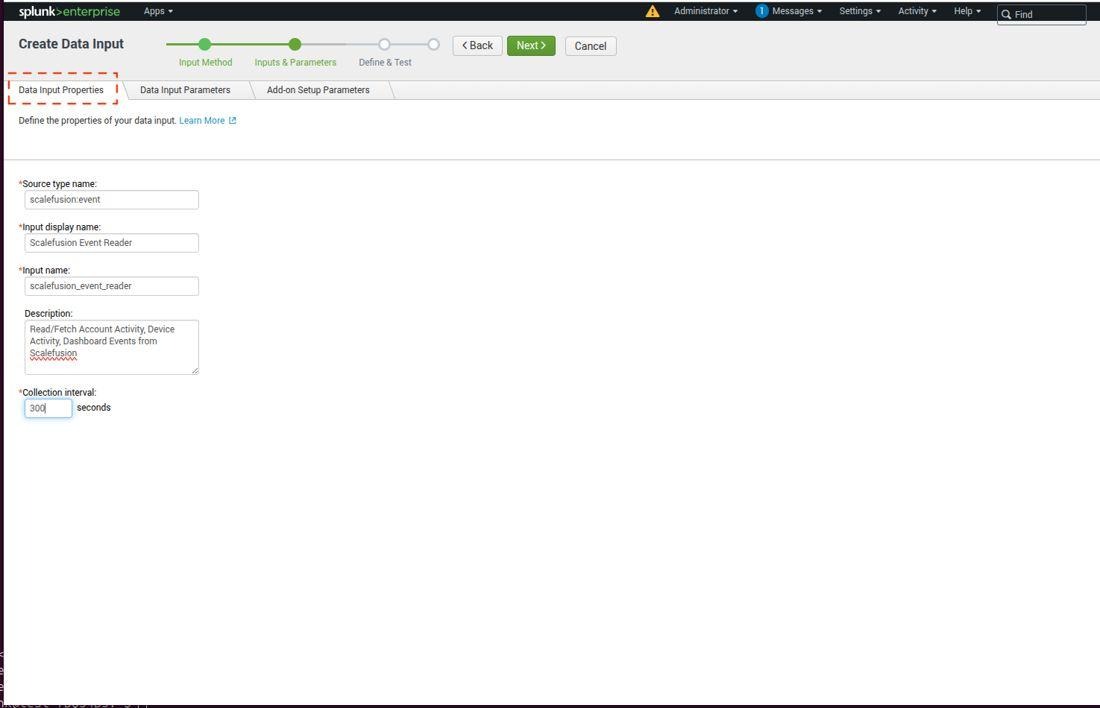
On the Data Input Properties tab, enter:
C. Define the parameters
Data Input Parameters tab
Drag a Text field into the middle panel.
Set Display label to Cursor and Internal name to cursor.
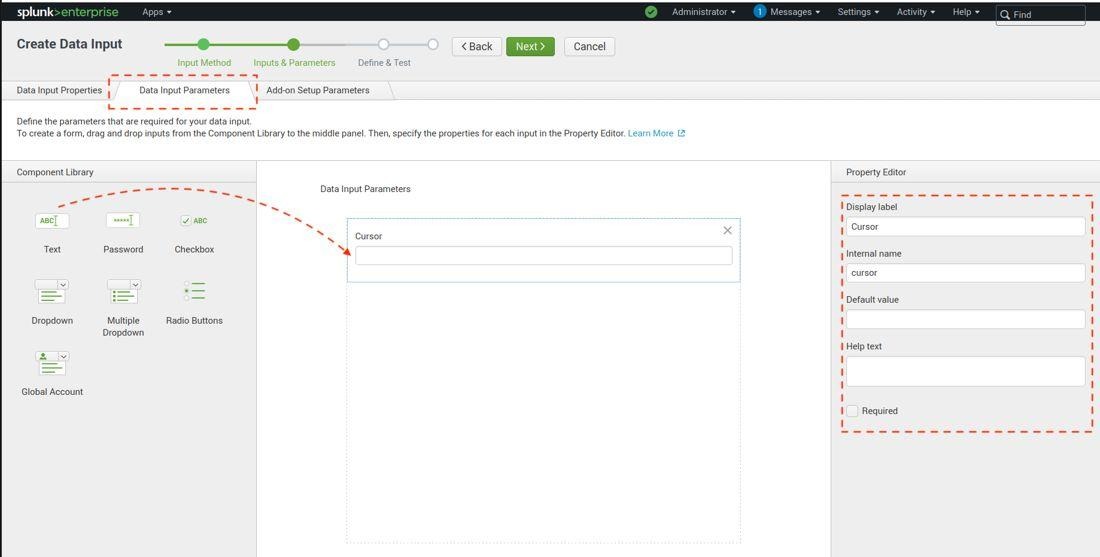
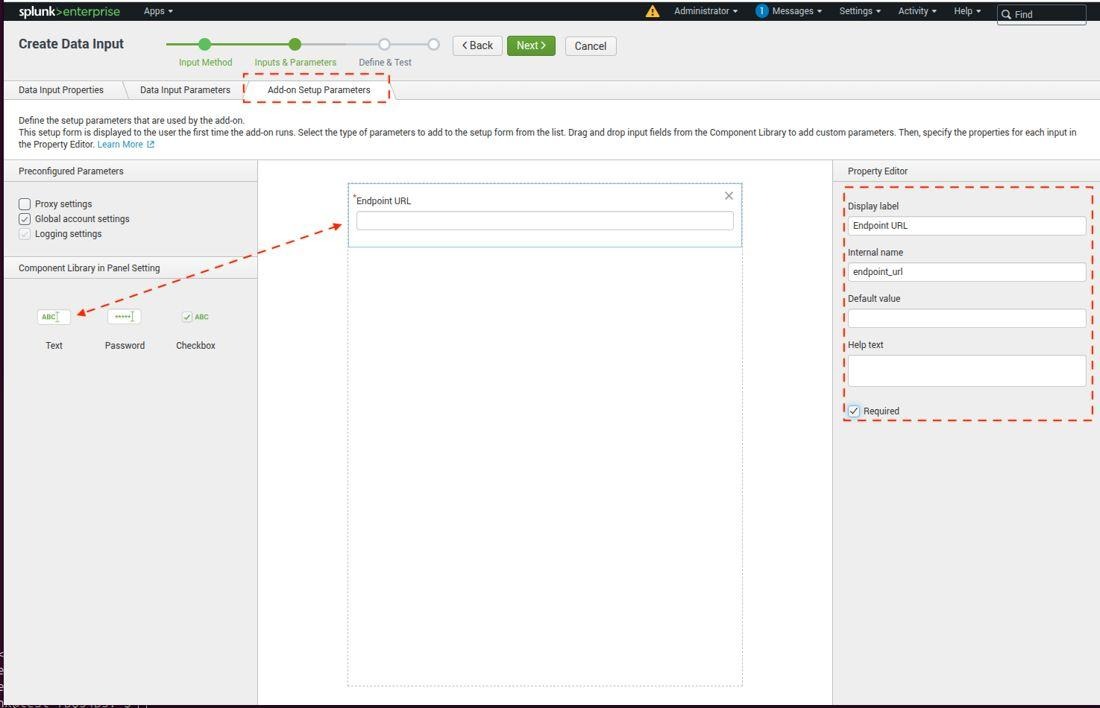
Add-on Setup Parameters tab
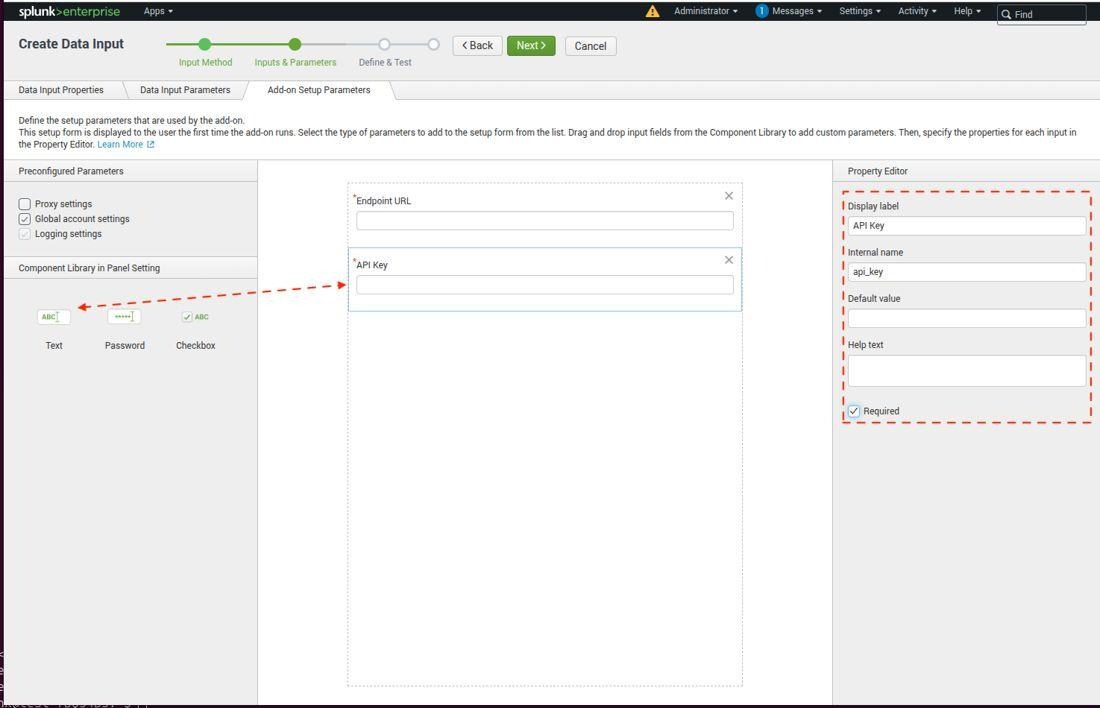
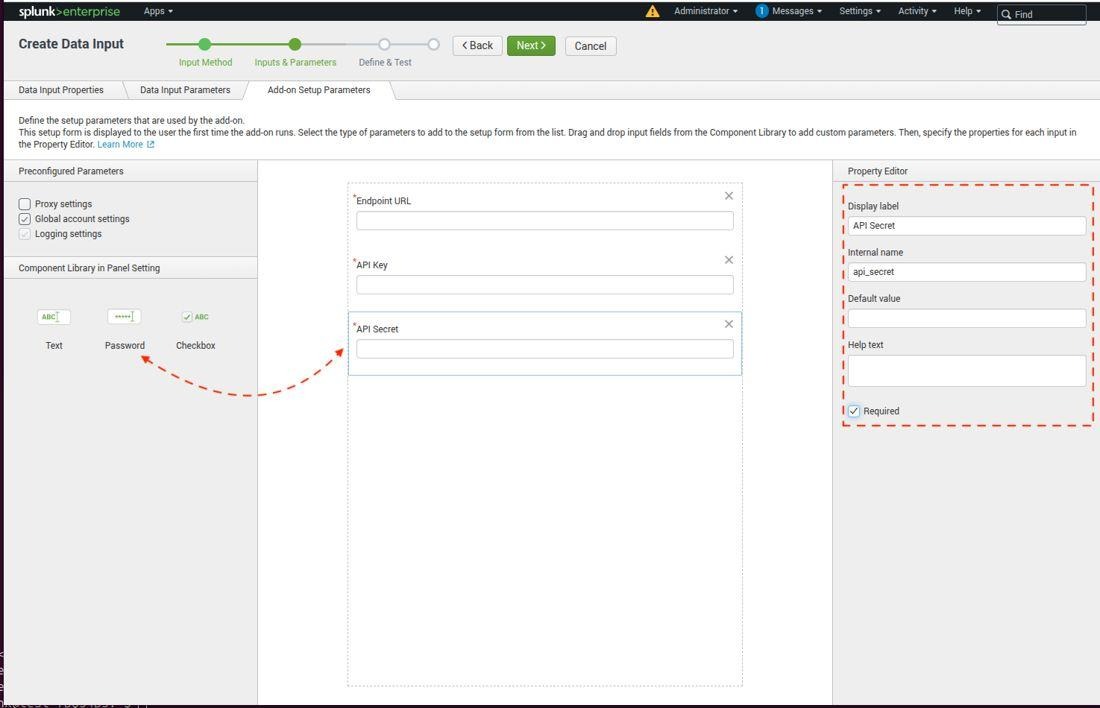
Drag fields into the panel and set them as follows:
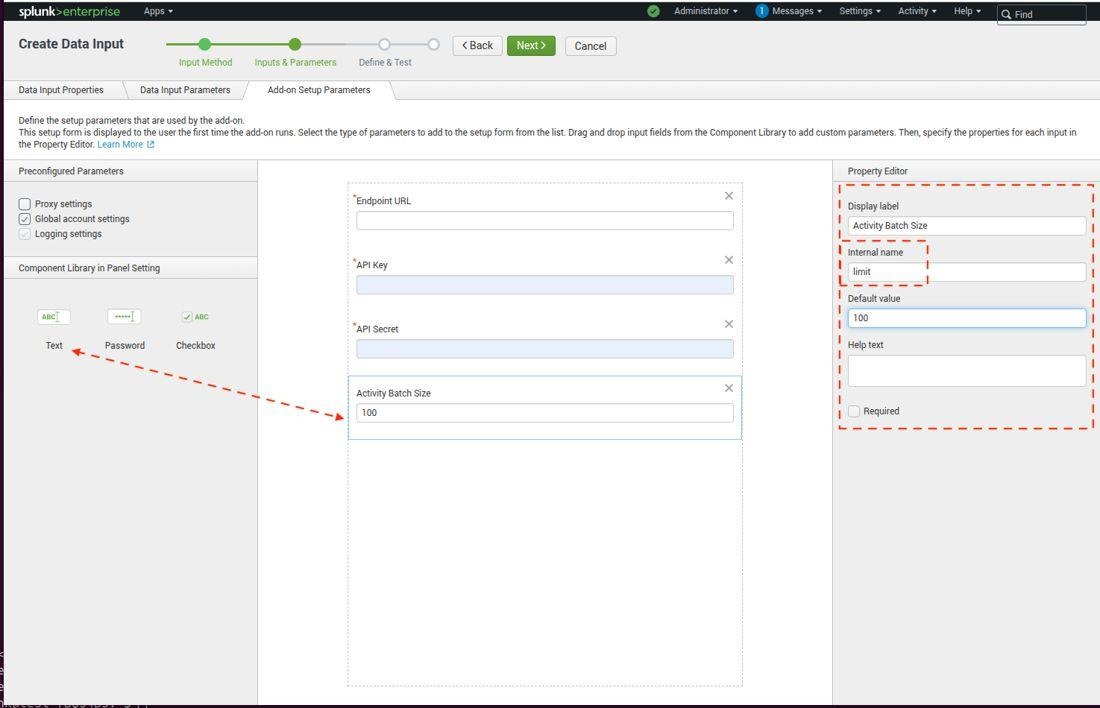
D. Add the Scalefusion script and test
Click Next to reach Define & Test.
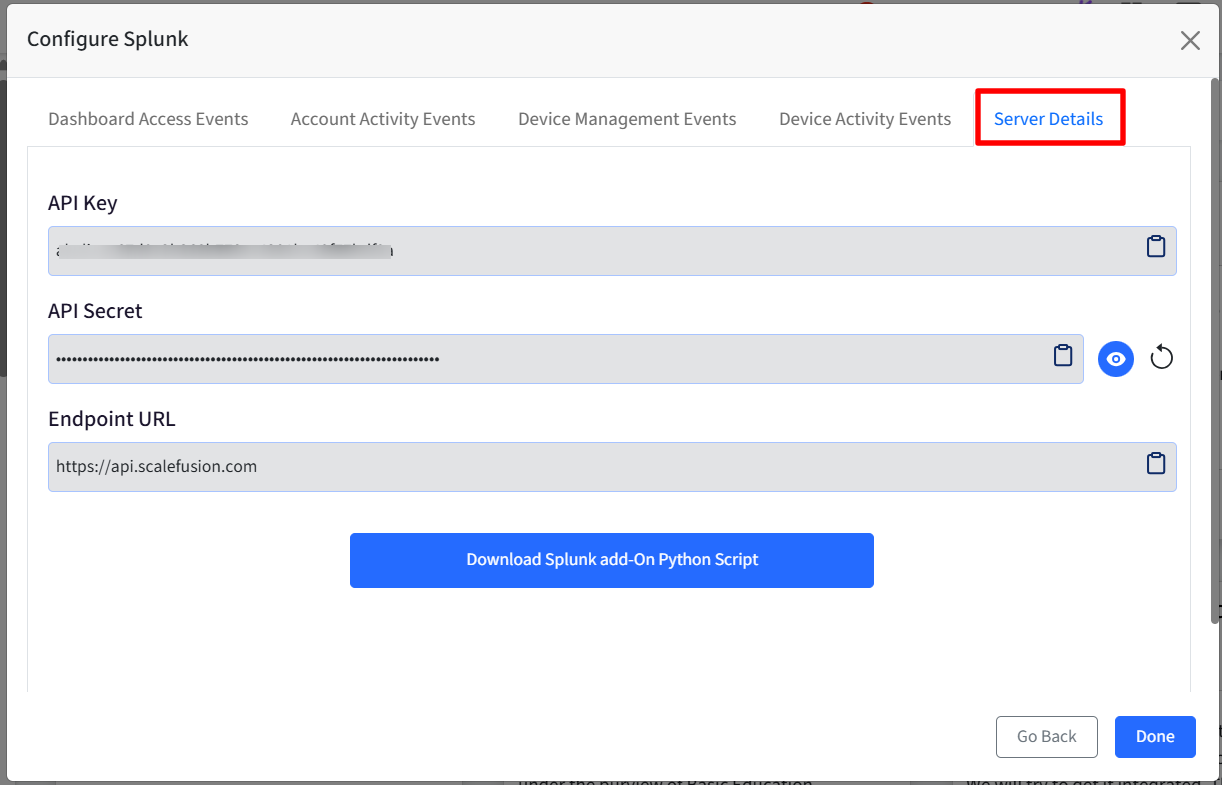
In the Scalefusion Dashboard, go to Integrations → ITSM/SIEM Tools → Configure Splunk.
Copy these from the Server Details tab:
API Key
API Secret (click the eye icon to reveal)
Endpoint URL (e.g. https://api.scalefusion.com)
Click Download Splunk add-On Python Script.
Back in Splunk, open the Add-on Setup Parameters tab and paste in the Endpoint URL, API Key, and API Secret. Leave Activity Batch Size at 100.
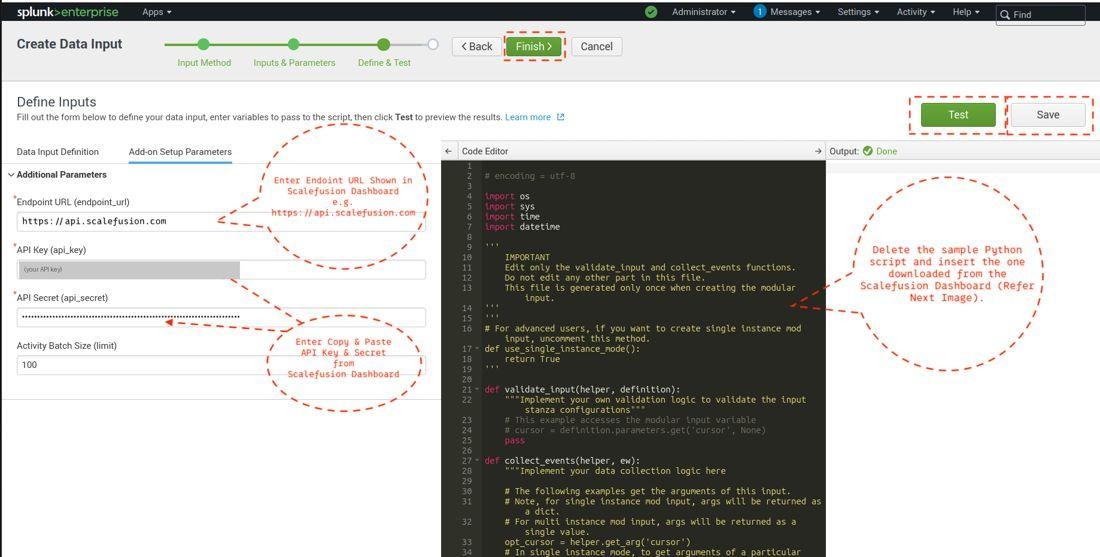
In the Code Editor, delete the sample Python code and paste in the downloaded Scalefusion script.
Click Test. Check that the output panel shows Done.
Click Save, then Finish.
You should see a Done! screen summarising your input.
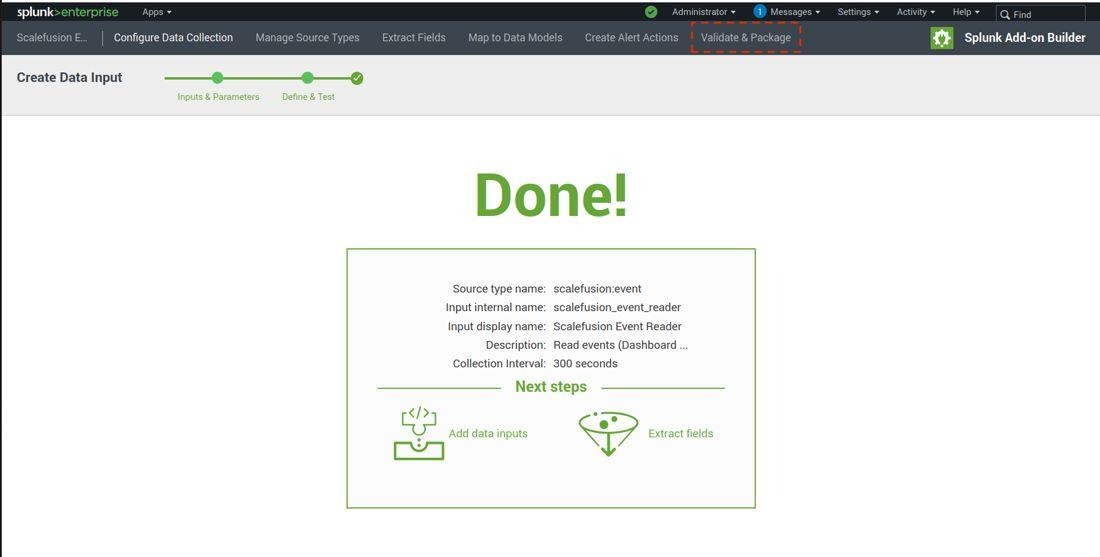
Skip these: Validate & Package is optional and not required for this setup.
Step 4: Restart Splunk
Restart so the new add-on loads:
/opt/splunk/bin/splunk restart
After restart, Scalefusion Event Reader appears in the left Apps panel on your Splunk home page.
{width=6.3in}
Step 5: Configure the add-on and start collecting
Click Scalefusion Event Reader in the left sidebar.
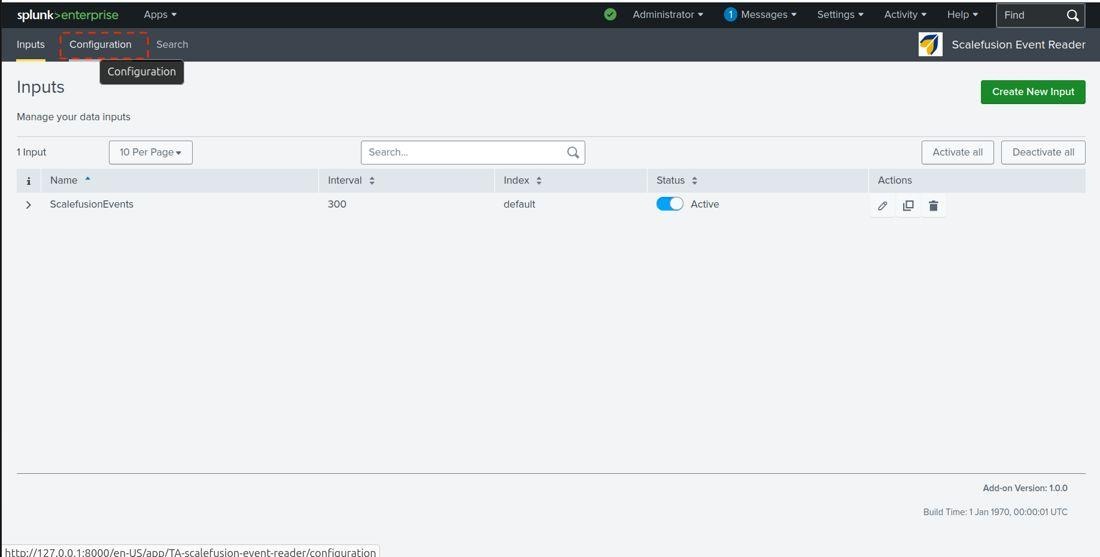
Open the Configuration tab and enter your Scalefusion Endpoint URL, API Key, and API Secret, if prompted.
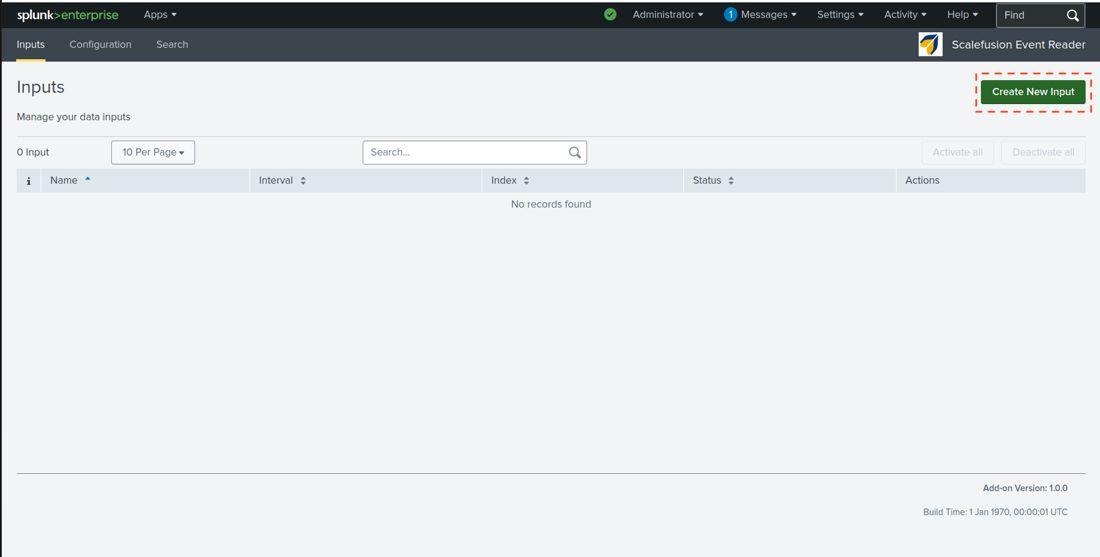
Go back to the Inputs tab and click Create New Input.
Fill in:
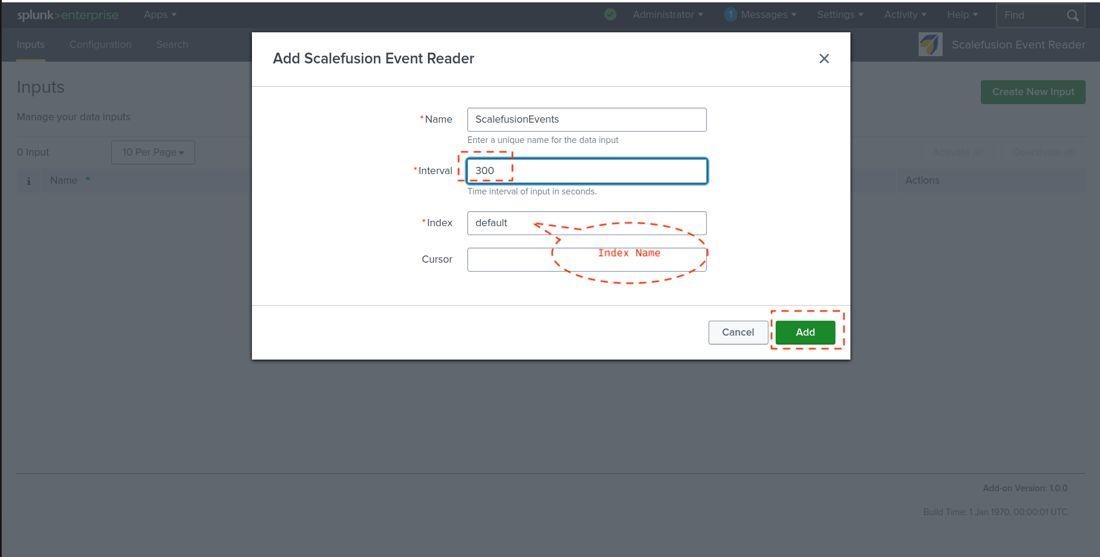
Click Add.
Confirm your input appears in the list with status Active.
Verify it works
Open the add-on’s Search tab.
Run:
index=<your_index> sourcetype="scalefusion:event"
Events should appear within a few minutes (the input runs every 300 seconds).