ScreenTime Reports help IT Admin see the usage time of devices and applications on Android devices. It also gives a track of the user's login/logout activities on Windows device(s).
It is a collection of Reports that lets the Admins know the time spent on the managed devices and on the apps installed on those devices. This is a collection of following reports,
Device Usage: Active and idle Times on a device based on the device's Screen On and Screen Off times
Application Usage: Application usage trends containing information like App with topmost usage, foreground time etc.
User Activity & User Activity Details: Login/logout activity of users enrolled on Windows devices
Login Attempts: Successful and Failed Login attempts made by users on Windows, macOS or Linux devices
Platforms
Report Name | Platform |
Device Usage | Android |
Application Usage | Android, Windows |
User Activity & User Activity Details | Android, macOS, Windows, Linux, Shared iPad |
Login Attempts | Windows, macOS, Linux, Shared iPad |
Steps:
Navigate to Reports & Workflows > Reports and click on ScreenTime
Select Filters to configure your report
Filter
Description
Select Activity
Select one from the following:
Application Usage: Shows the application's usage based on the app's open time during the selected duration.
Device Usage: Basing on the Screen ON/OFF events on the device, it collects the active and passive (idle) times of device(s)
User Activity: Shows users' login/logout activities on Windows devices.
Select Group
Lists Device Groups and Sub-Groups. Select a device group/sub-group.
Select Device
Lists all the enrolled devices. If a Group is selected, then it lists only the devices which are part of that group. Select a device.
Devices in both Kiosk and Agent modes are counted in the App Usage
Select Application
This filter is displayed only when the activity type is Application usage. It is activated once a group or device is selected and populates only those applications that have reported usage.
Select Date Range
Select the Date Range for which you want to check the usage.
.png)
For the User Activity Report, the filters are different. They are explained in the User Activity section below
After selecting filters, click on Show Report
Reports Output
Based on selected activity, the report gets generated each with a different set of details. Let's understand the information you get on selecting each.
Application Usage
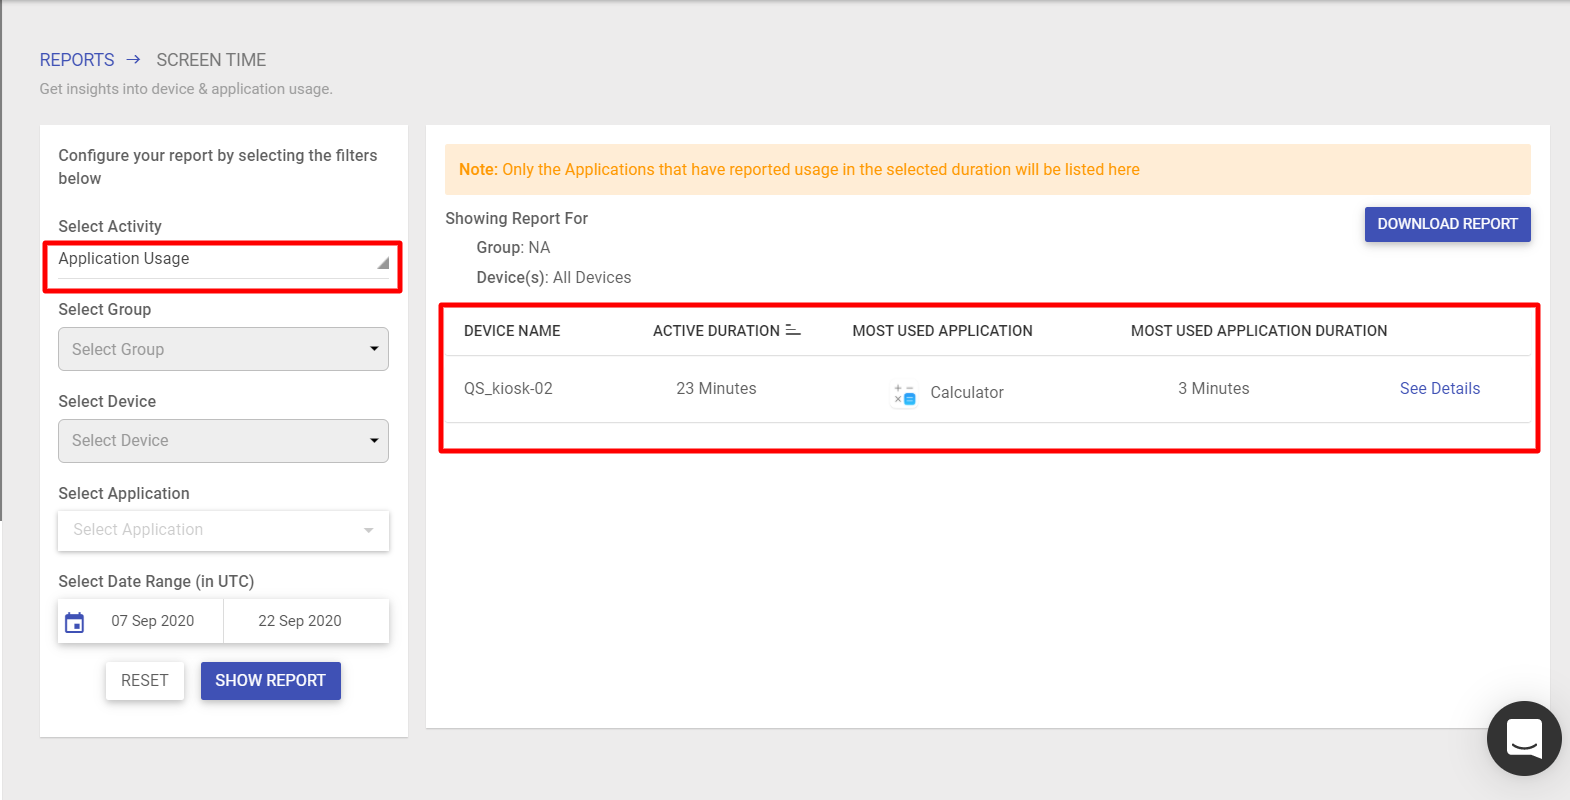
The Application Usage Report gives an account of the app's usage on a device along with other related information. As a result, the following details show up:
If no application is selected: Device wise list of the most used app (on each device), are displayed:
Device Name: Name of the enrolled device
Active Duration: Total time the device was active based on device usage record
Most Used Application: The topmost used application on the device in this duration
Most Used Application Duration: The total duration for which the top most app was used
With these details, admins can judge which apps are used mostly.For the devices in Agent mode, those apps will be taken into count, which is under Scalefusion-locked mode
See Details: Clicking on this opens a new dialog box showing graphically, the usage of apps on the device:
Overall Application Usage: This shows the total usage time of apps in the selected duration.
Average Per Day Application Usage: Shows the usage time of the apps on a per-day basis on an average, based on selected duration.
If the app usage duration is in seconds or milliseconds, then no bar will show up in the graph
.png)
If an application is selected in the Application filter, that particular app's usage details are displayed:
Device Name: Name of the enrolled device
Active Duration: Total time the device was active based on device usage record
Application Foreground Time: The total time for which the app was in the foreground on the device.
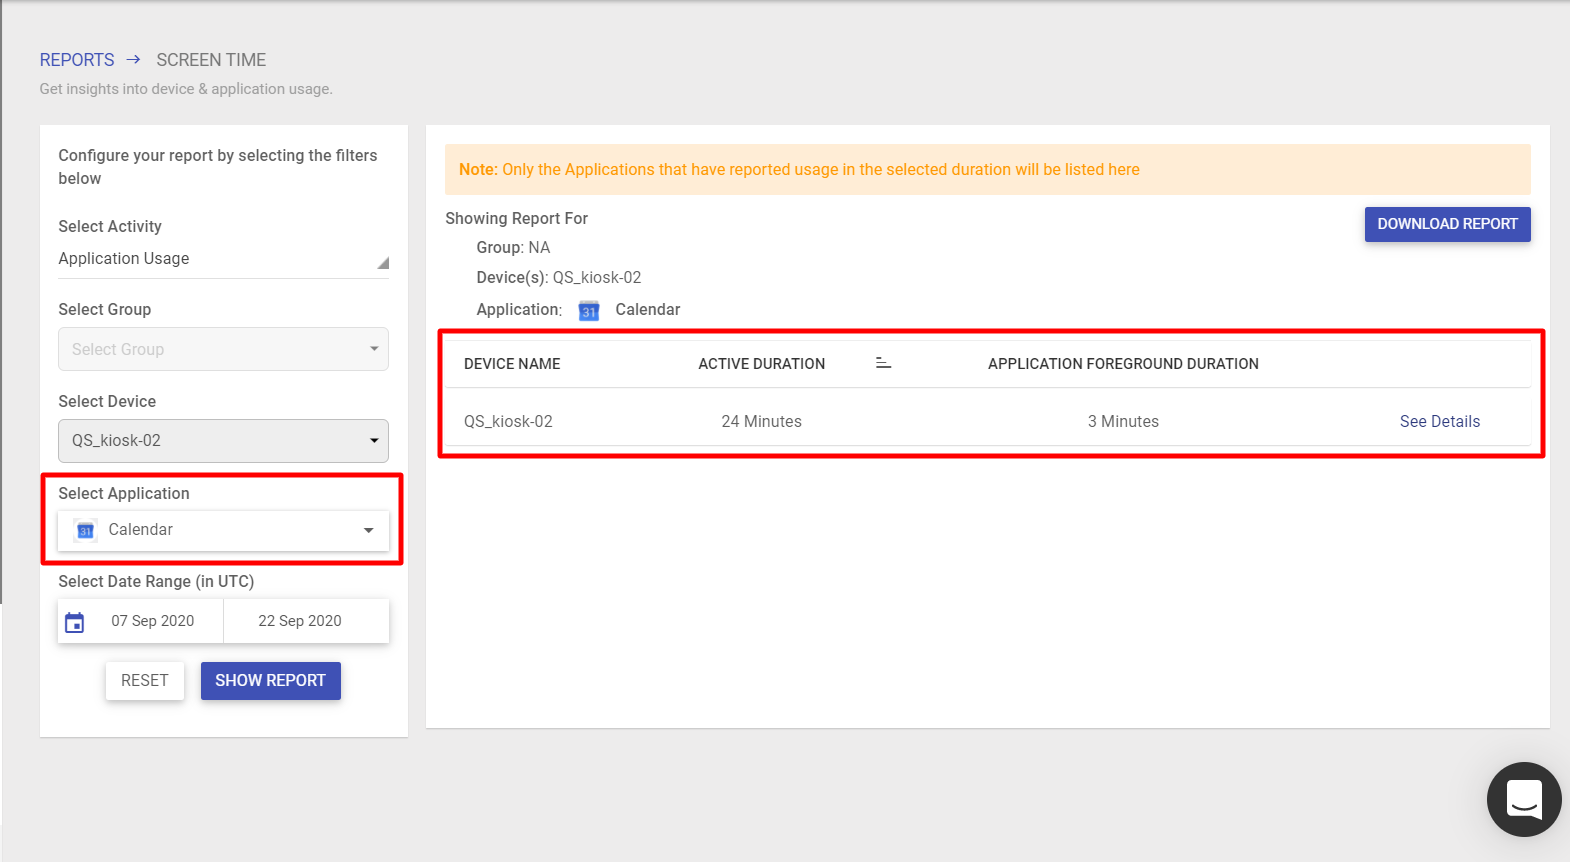
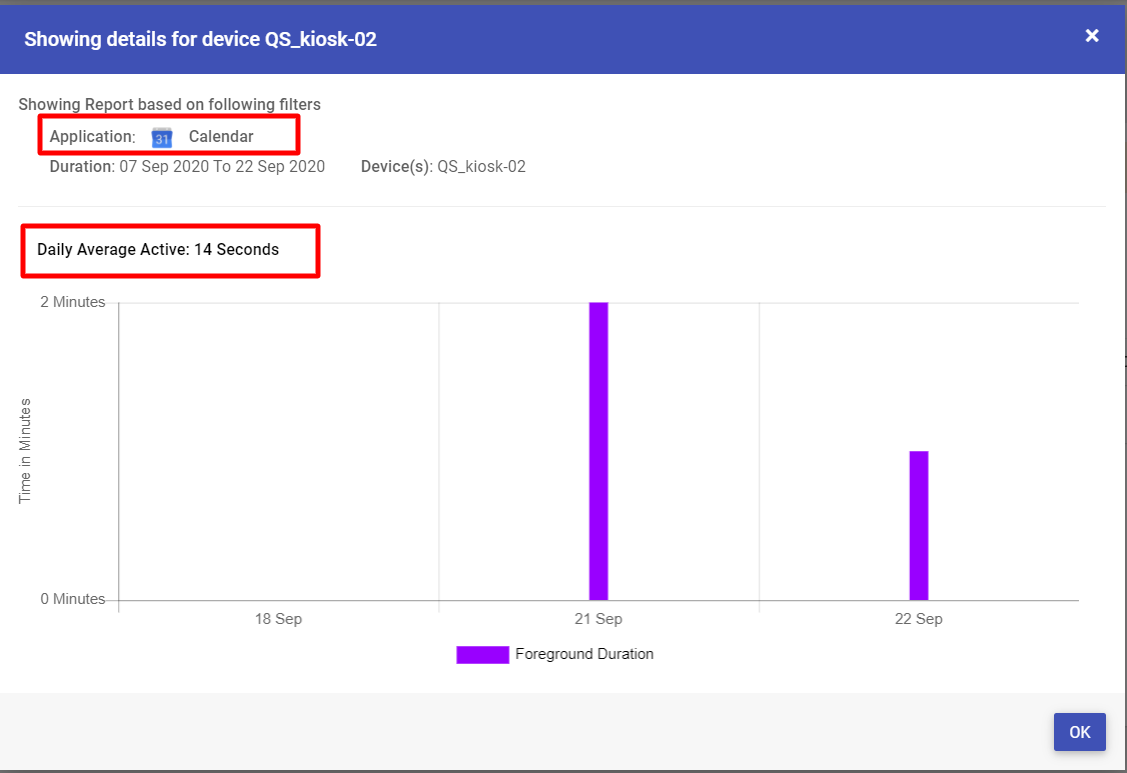
See Details: Clicking on this opens a new dialog box showing graphically, the daily usage of the selected app on the device. It also gives the app's Daily average active time.
Device Usage
The device usage report shows the overall time spent on a managed device. The usage is judged on the basis of the device's active and idle times, where Screen On is considered Active and Screen Off is Idle. The following details show up:
Device Name: Name of the enrolled device(s)
Active Duration: Total time the device was active (Screen was On)
Idle Duration: Total time for which the device was idle (Screen was Off)
Average Active Duration: The average time for which the device was active
With these details, admins can judge the screen time spent on devices.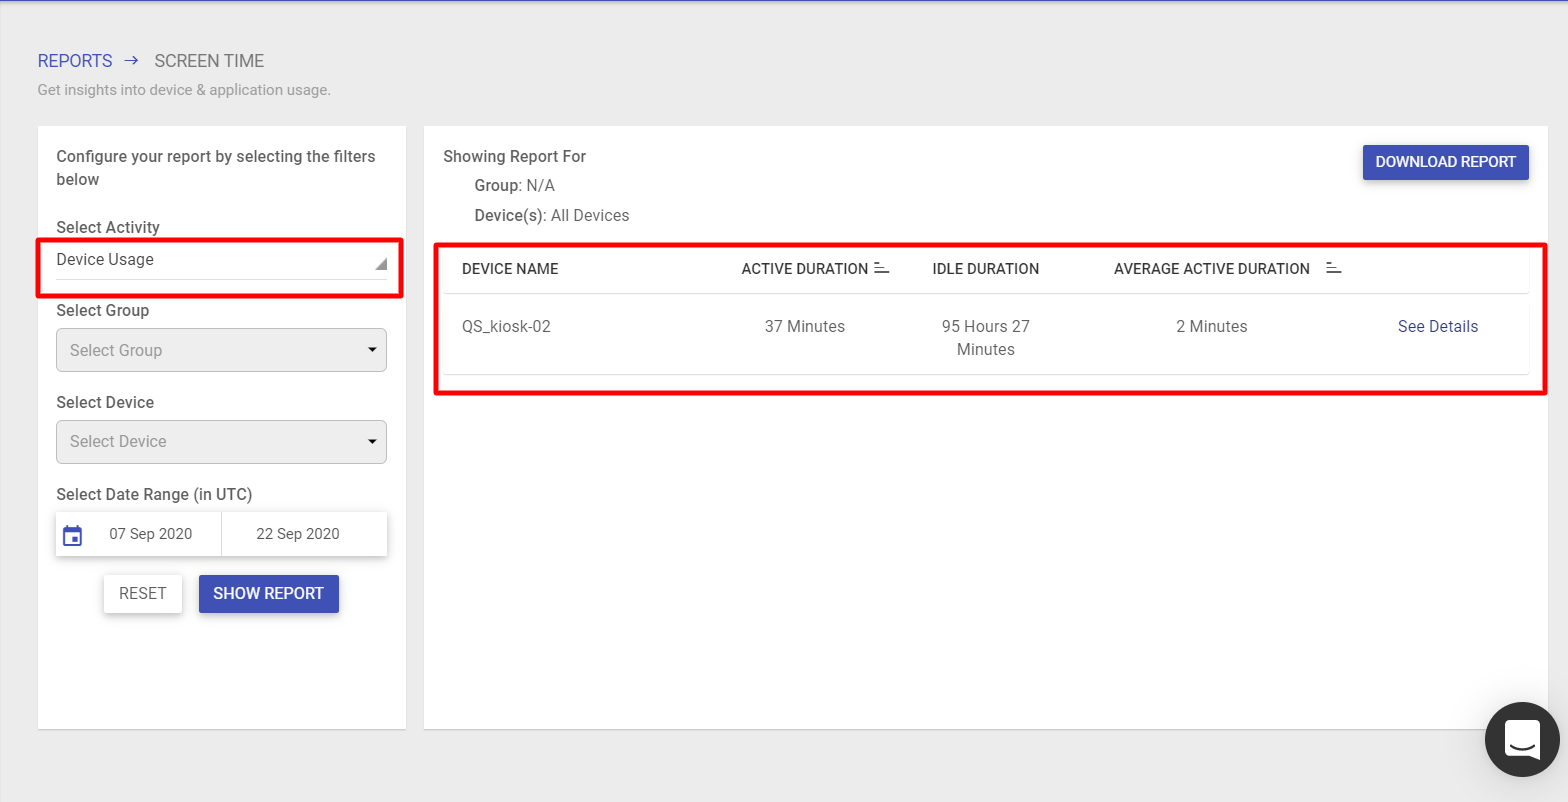
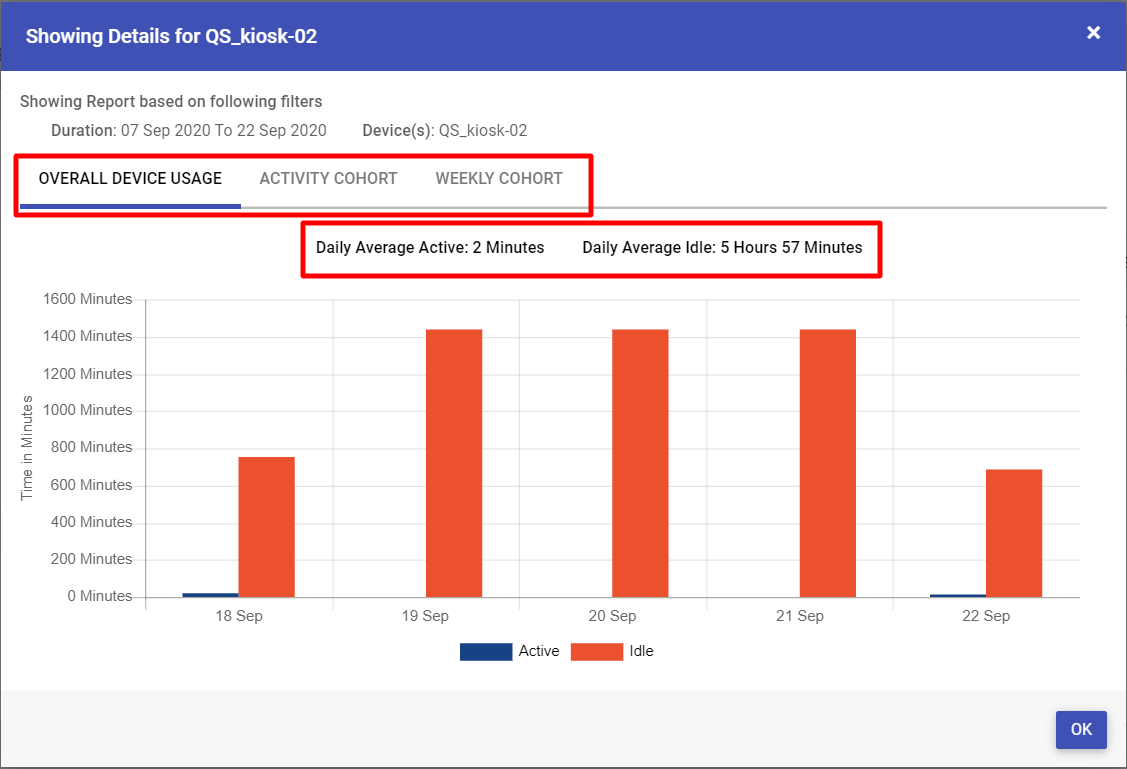
See Details: Clicking on this opens a new dialog box showing graphically, the active and idle times of the device:
Overall Device Usage: Shows date-wise usage of the device. It includes each day of the selected month and also displays daily average active and idle times.
Activity Cohort: Shows device Usage (Active and Idle Times) in every three-hour time range during the selected duration. This way, you can know the hour ranges when the device is used most actively.
The timezone is in UTC format
Weekly Cohort: Shows device usage on each day of the week so you can know on which days the device has been used actively.
User Activity
The User Activity report shows the user's login/logout activity along with other details. This helps the admin in tracking the time spent by a user on the device.
Platforms Supported
Windows, Linux, Shared iPad, Android, macOS
Prerequisite
Scalefusion MDM agent should be installed on the enrolled Windows device.
Steps
Select Filters to configure your report
Filter
Description
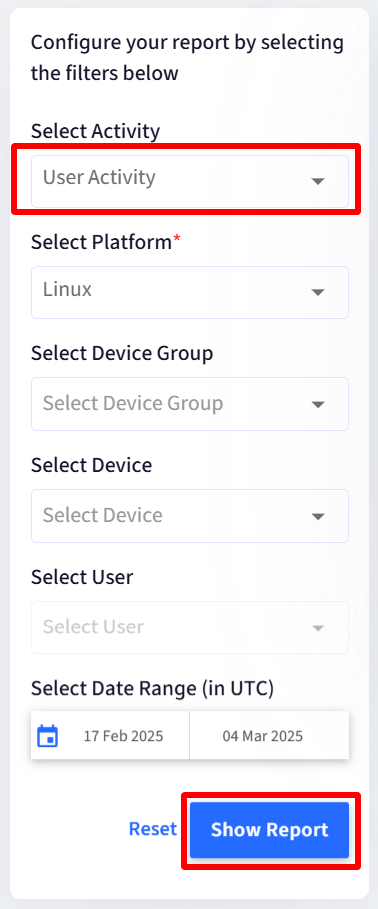
Select Activity
Select User Activity
By default, 'Application Usage' is selected
Select Platform
Select the platform for which you want to view reports.
Select Group
Lists Device Groups and Sub-Groups. Select a device group/sub-group.
Select Device
Lists all the enrolled Windows devices. If a Group is selected, then it lists only the devices which are part of that group. Select a device.
Select User
This filter is displayed only when the activity type is User Activity. It is activated once a device is selected in the 'Select Device' filter and populates the users created on that device.
Select Date Range
Select the Date Range for which you want to check the user activity.
After selecting filters, click on Show Report
Report Output
If no user is selected in the filters, it gives device-wise bifurcation and then the time spent by each user on the device. The following details show up:
Device Name: Name of the enrolled device(s)
Total User Count: Total users on the device
Most Active User: Out of all the users, the one who has spent the most time on the device
Most Active User Time: The longest time spent by the most active user on the device
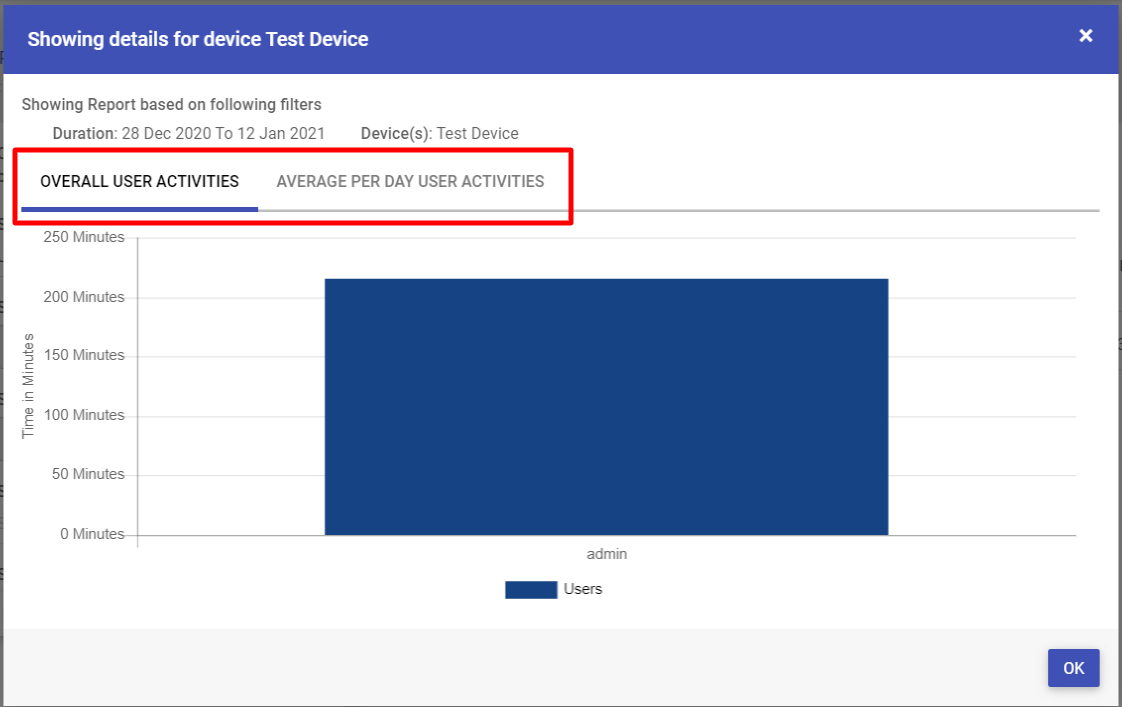
With these details, admins can monitor the time spent by users on their devices.See Details: Clicking on the eye icon under Actions opens a new dialog box showing graphically the overall user activities in the selected duration:
Overall User Activities: Shows time spent on the device by each user.
Average Per Day User Activities: Shows average time spent by each user per day. This lets the admin analyze the average time spent by users on a daily basis.
Hovering over the bars on the graph shows the exact time spent by the user on the device.
If a user is selected in the filters, that particular user's activity on the device is displayed with the following details:
Device Name: Name of the enrolled device
Average Active Time: The average time for which the selected user is online per day
Average Logoff Time: The average time for which the selected user is inactive or logged off
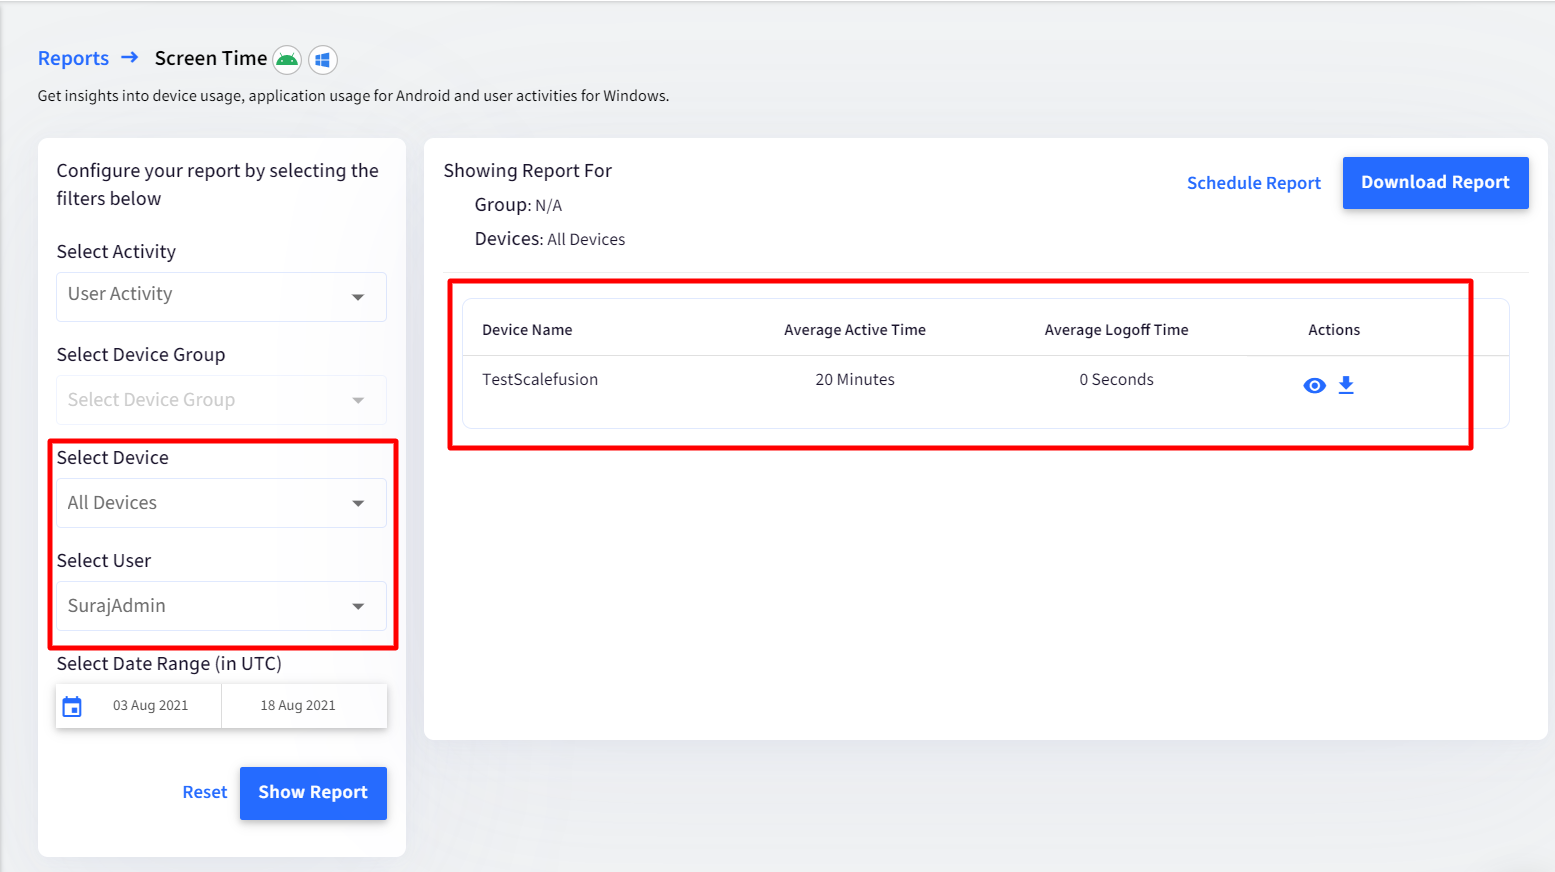
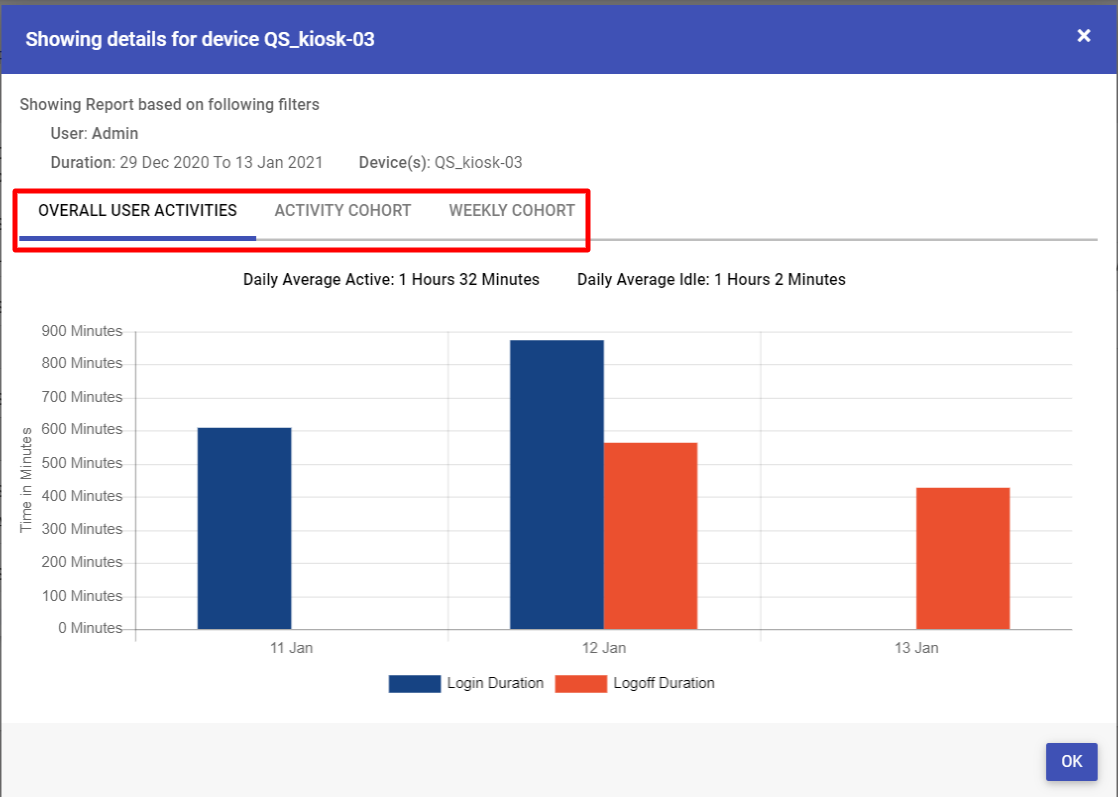
See Details: Clicking on the eye icon under Actions opens a new dialog box showing graphically, the overall activities of the selected user in the selected duration:
Overall User Activities: The Login and logoff time duration of the user on a daily basis. It includes each day of the selected duration and also displays daily average active and idle times.
Activity Cohort: Shows user activity (Active and Idle Times) in every three-hour time range during the selected duration. This way, you can know the hour ranges when the user is online most of the time. The timezone is the one selected by the user in the Profiles section.
Weekly Cohort: Shows user activity on each day of the week so you can know on which days the user has been actively online.
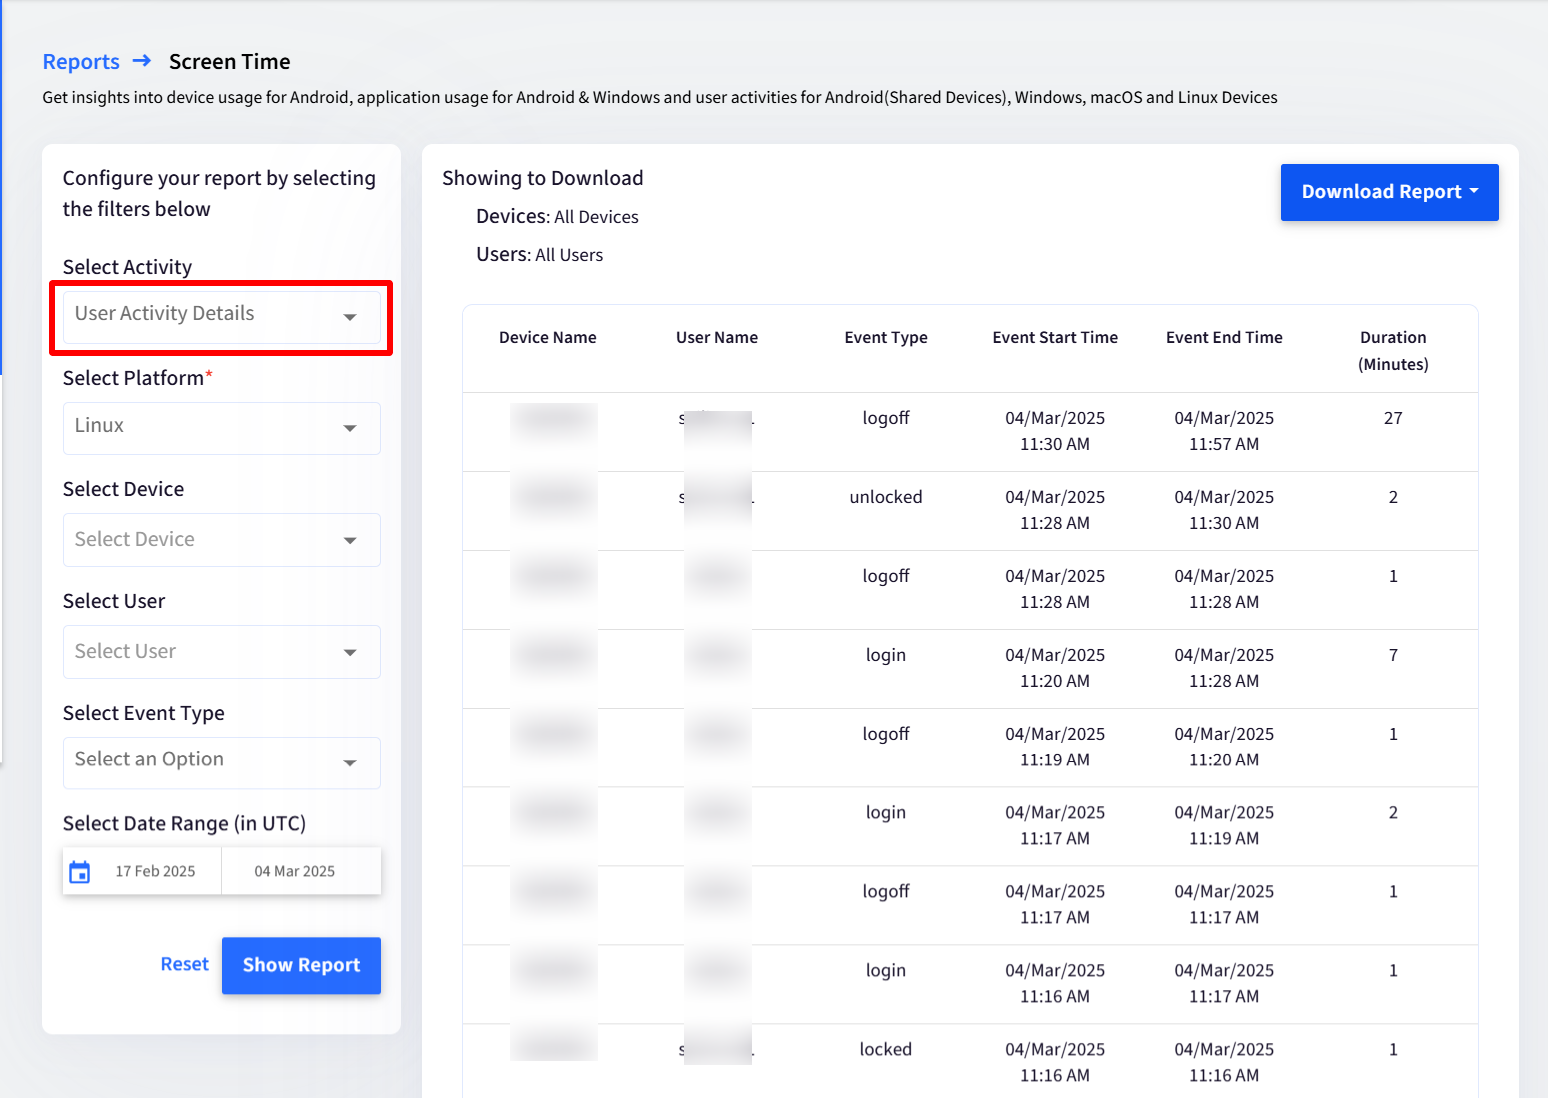
User Activity Details
User Activity Details report gives more granular details on the managed devices giving the admins insights into the login/logoff times at a per-user level. For this, provide the filters and download the report in CSV format.
Platforms Supported
Windows, Linux, Shared iPad, Android, macOS
Steps
Select Filters to configure your report
Filter
Description
Select Activity
Select User Activity Details
Select Platform
Select the platform for which you want to view the report
Select Device
Lists all the enrolled devices. To get the details for all devices, select All Devices
Select User
Lists all the users on devices. If a device is selected, then the users on that device are listed. If you want to check the activity of all users, select All Users
Select Event Type
Select all or a particular event type (login, logoff, locked) for which you want to view the report.
Select Date Range
Select the Date Range for which you want to check the user activity details.
By default, the start date is 15 days from the current date. The maximum time for which the report can be viewed is 30 days from the current date.
After selecting filters, click Show Report
Based on selected filters, you will get User Activity details:
Device Name
User Name
Event Type: Login / Locked / Logoff
Event Start Time
Event End Time
Duration (in Minutes)
Login Attempts
Login Attempts report gives information about login activities (Successful or Failed) of users on devices. This will help IT Admins to identify how many times any user has successfully logged in or failed to login on a device. Also, if any other user tries to login to the machine and fails, that data is captured via this report minimizing the chances of security breach.
Platforms Supported
Windows, macOS, Linux, Shared iPad
Pre-requisites
For Windows, the latest version of Windows MDM Agent should be installed on enrolled Windows devices
For macOS, the latest version of Scalefusion MDM Client should be installed on enrolled Mac devices
For Linux, latest Scalefusion Tux agent should be installed on Linux devices
Device Configurations:
Windows: Windows Home, Pro, Enterprise, Business, Education
Steps
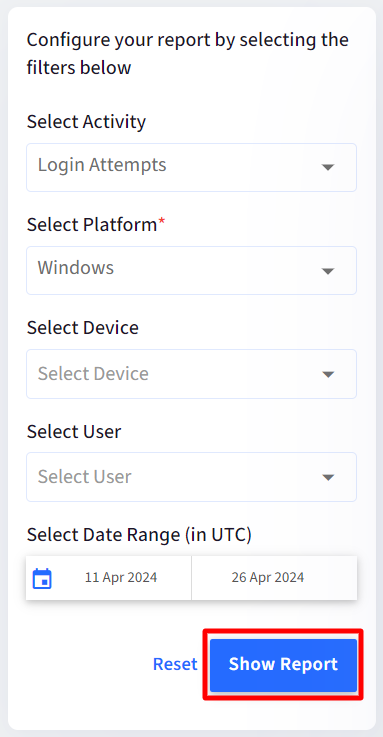
Select Filters to configure your report
Filter | Description |
Select Activity | Select Login Attempts from the drop-down |
Select Platform | Select the Platform from the following
Selecting All Platforms will give report for all users. |
Select Device | Lists all the enrolled devices. Select a device. For getting a report of all devices, select All Devices |
Select User | Lists the users existing on devices. Select All Users if you want to view report for all the users else select one user. |
Select Date Range | Select the Date Range for which you want to check the login attempts. |
After selecting filters, click on Show Report
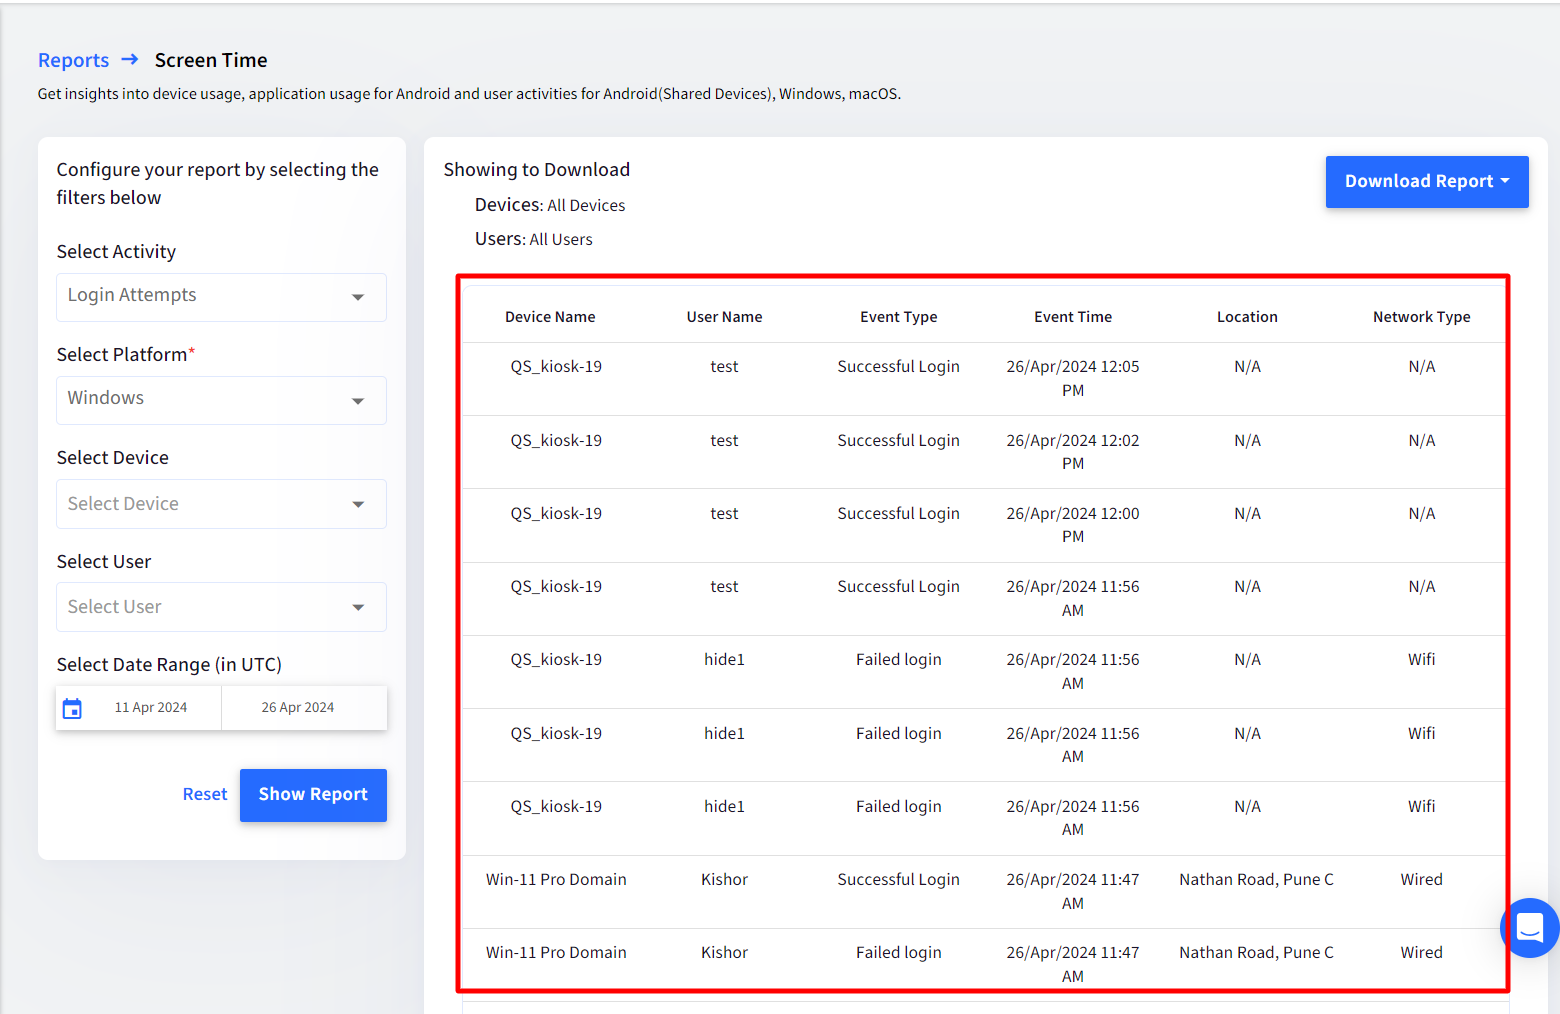
Report Output
Based on your selection, following information will be displayed with respect to Login Attempts:
Device Name: The Name of the device
User Name: Username of the user who has attempted to login to the device.
Event Type: Displays Successful Login if the user logged in successfully and Failed Login if user was unable to login to the device.
Any Login attempt can also be called as Failed if
User signs in with Local login in a OneID configuration and enters incorrect credentials
Event Time: The date and time at which user tried to login to the device. The timezone will be based on settings configured under user account profile.
Location: The address of the location from where user logged in
Location is not displayed for macOS and Linux devices
Network Type: The type of network which user was on at the time of login. It can be any one of the following:
NA: If no network type is reported
Wired: If it is an Ethernet or LAN network
Wifi: If it's a Wifi connection
Note: If the device is not connected to the internet at the time of login, then No internet connection will display under Network typeFor macOS devices, Network Type will be displayed only if it's a Failed Login attempt
Additional Features
Download: The reports get downloaded in CSV format by clicking the Download Report button under different heads as per report selection.
Device Usage: Device Name, Device Group, IMEI Number, Serial Number, Date Range, Total Duration (Minutes), Device Active Duration (Minutes), Device Idle Duration (Minutes), Average Active Duration (Minutes), Average Idle Duration (Minutes), Most Active Hours, Device usage Data
Application Usage: Device Name, Device Group, IMEI Number, Serial Number, Date Range, Total Duration (Minutes), Most Used App, Most Used App Duration (Minutes), App Usage Data
User Activity: Date Range, Device Name, Group, IMEI Number, Serial Number, Average Active Time(Minutes), Average Logoff Time(Minutes), User Activity (JSON)
User Activity Details: Device Name, Serial Number, User Name, Event Type, Event Start Time, Event End Time, Duration (Minutes)
Login Attempts: Device Name, User Name, Event Type, Event Time, Latitude, Longitude (Latitude and Longitude details are only for Windows devices), Address, Network Type, Network Name (name of network if it's a wifi)
The naming convention of the CSV files, once downloaded, is automatically given based on the selected filters. For example, app_usage_report_07-09-to-22-09 would be the name of an Application Usage report for the date range 7th to 22nd September.
Reset filters: The filters selected can be cleared and re-selected. The Reset button clears all filters.