From Scalefusion Dashboard, you can get quick yet deep insights, statistically and graphically, about your device inventory, like a summary of devices enrolled platform-wise, how many are active/inactive, licenses used, and more. Not only this, Scalefusion also provides flexibility for IT admins to customize, configure and choose the information they want to view as per their requirements. This information is vital and helps organizations in analyzing and making business decisions.
All this information can be viewed from the DeepDive section of the Scalefusion Dashboard. This document gives a detailed description of the DeepDive section and the features it offers.
Mission Control
This section shows a snapshot of the inventory with Platform Summary, Device Type, license overview, etc. You can also set the DeepDive page as the Home page.
Log into your Scalefusion dashboard, and in the left-hand side menu, navigate to the DeepDive section.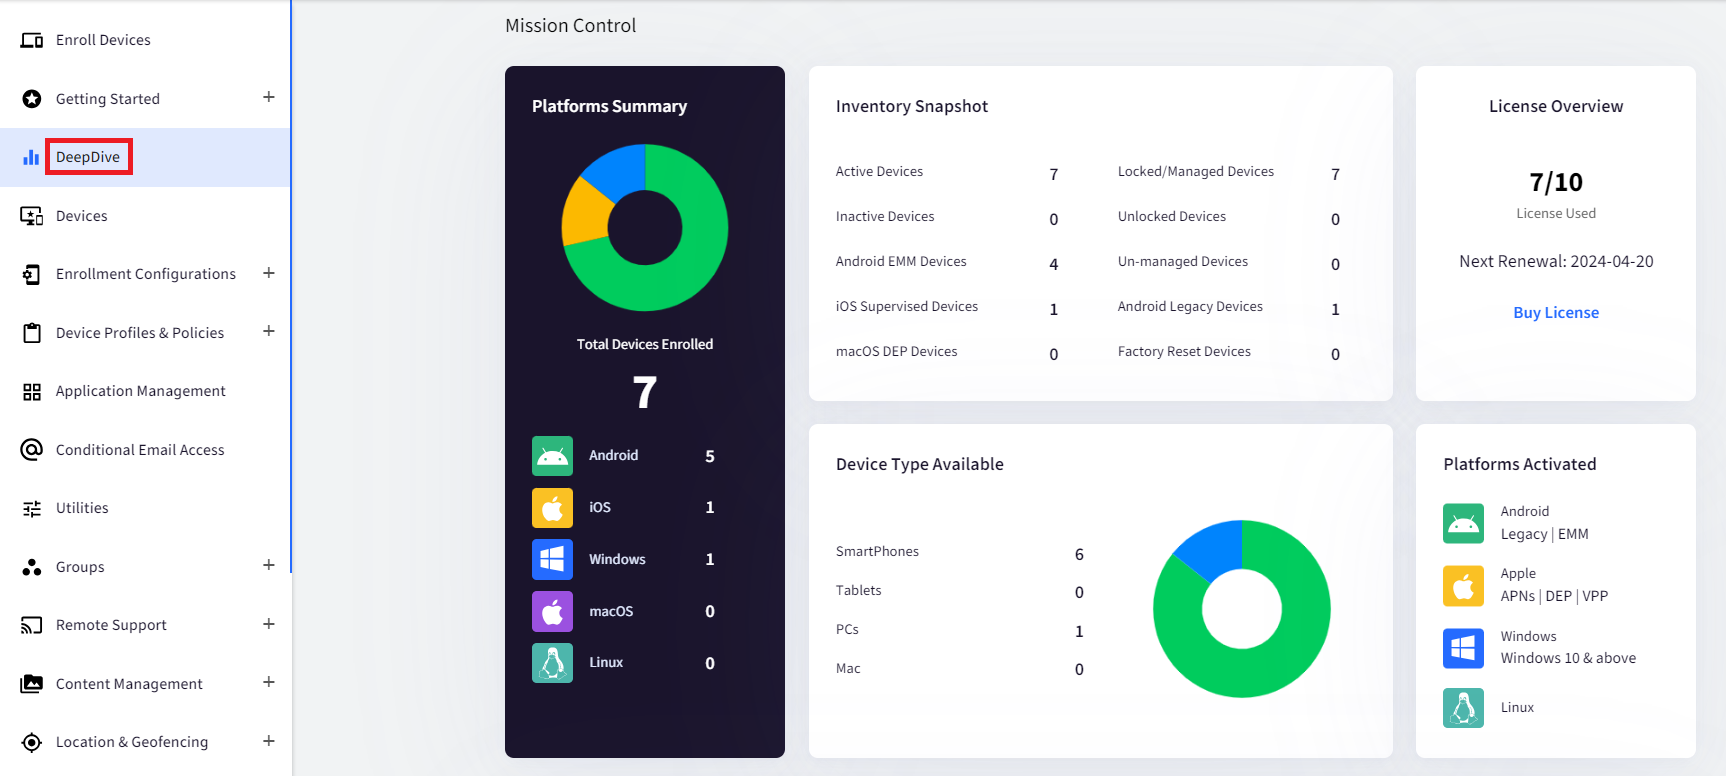
- Platform Summary: Overview of the managed devices belonging to different platforms like Android, iOS, Windows, macOS, and Linux.
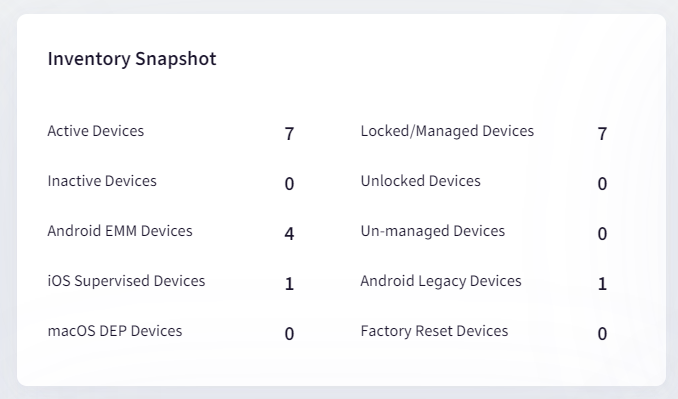
- Inventory Snapshot: Overview of the enrolled devices belonging to different platforms. Clicking on the respective names will redirect you to the Devices section showing the concerned devices.
- Active Devices: Devices that are online and actively used.
- Inactive Devices: Devices that are offline or are sitting idle.
- Android EMM Devices: Android devices that are enrolled as EMM-managed devices.
- iOS Supervised Devices: iOS devices that are Supervised.
- macOS DEP Devices: macOS devices that are DEP devices.
- Locked/Managed Devices: Devices that are locked and managed by Scalefusion MDM.
- Unlocked Devices: Devices that are no longer locked in Scalefusion MDM.
- Un-managed Devices: Devices where the Scalefusion MDM profile has been removed, for example, iOS, Mac, or Windows devices.
- Android Legacy Devices: Devices that have been enrolled using the Legacy method.
- Factory Reset Devices: Devices that have been reset either manually or with a factory reset push sent from the dashboard.
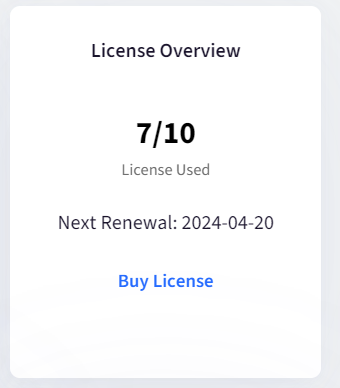
- License Overview: This shows an overview of the total number of active licenses and how many have been used with the renewal date.
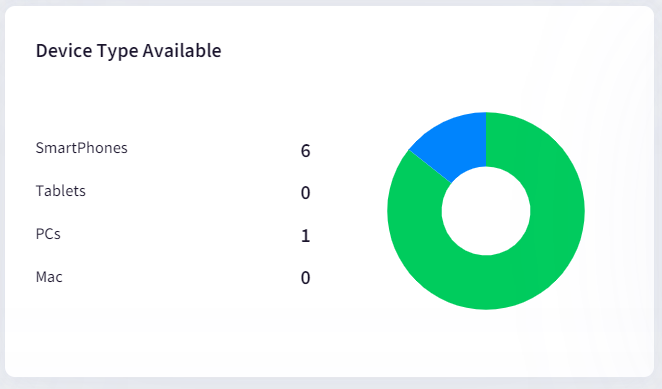
- Device Type Available: Shows the generalized device types that are enrolled.
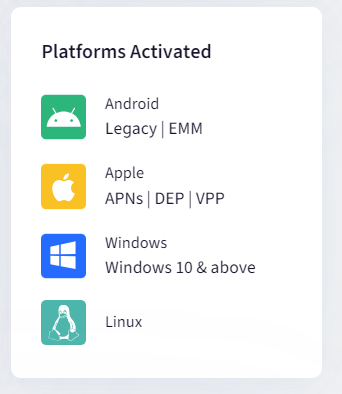
- Platforms Activated: Shows the different setups done for different platforms like Android Enterprise setup, Apple Setup, DEP setup, VPP setup, Azure AD setup, Windows Autopilot, etc.
Overview
Shows more comprehensive data related to your inventory and its usage. You can further filter it down to show the information based on the platform: Android or iOS, or you can select a Group.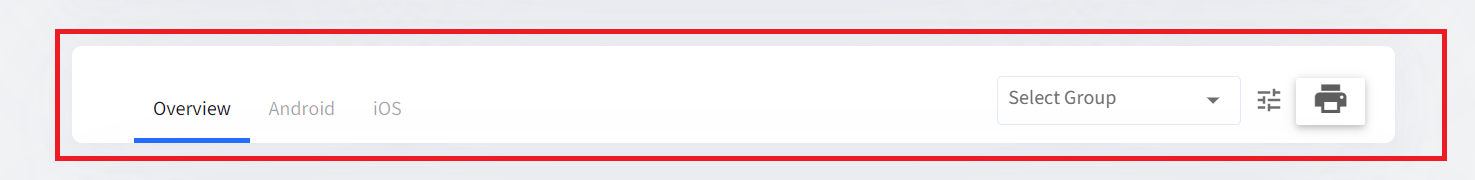
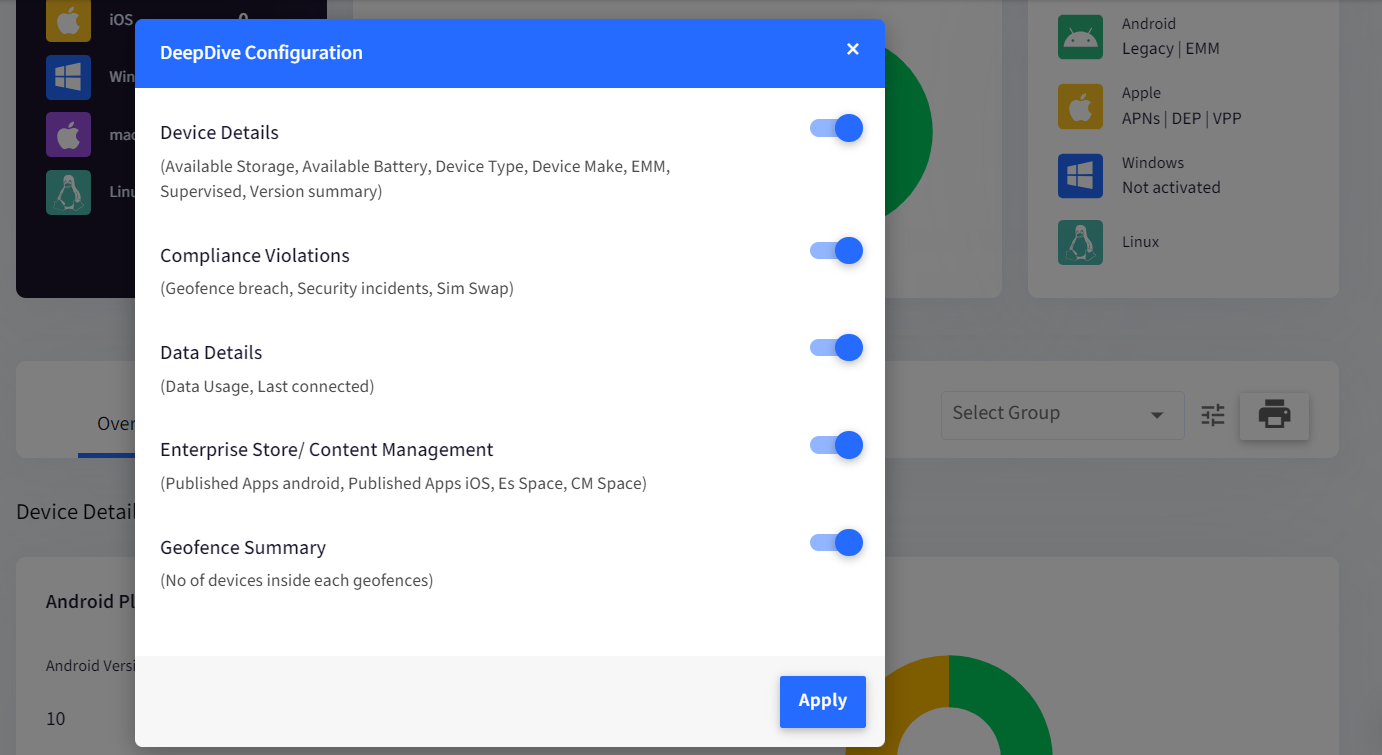
- DeepDive Configuration: Let you configure all the data you want to see on the DeepDive page.
- Download as PDF: You can also download the data shown on the DeepDive page in PDF format.
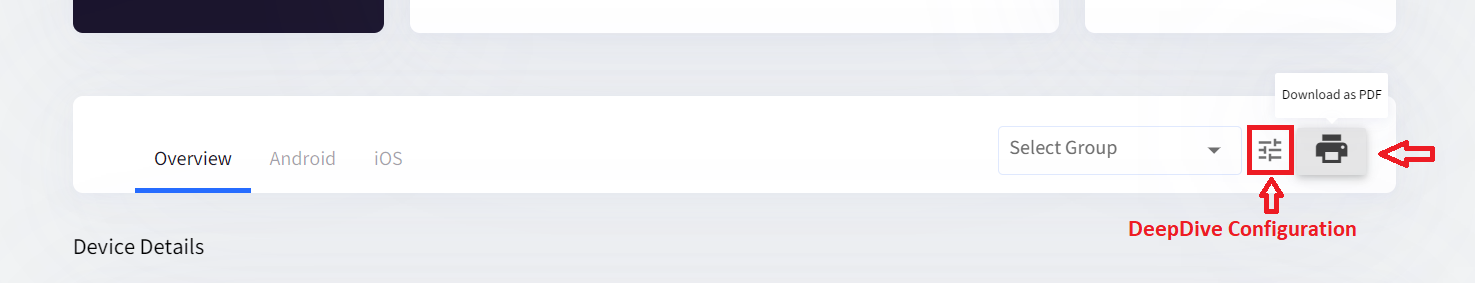
Device Details
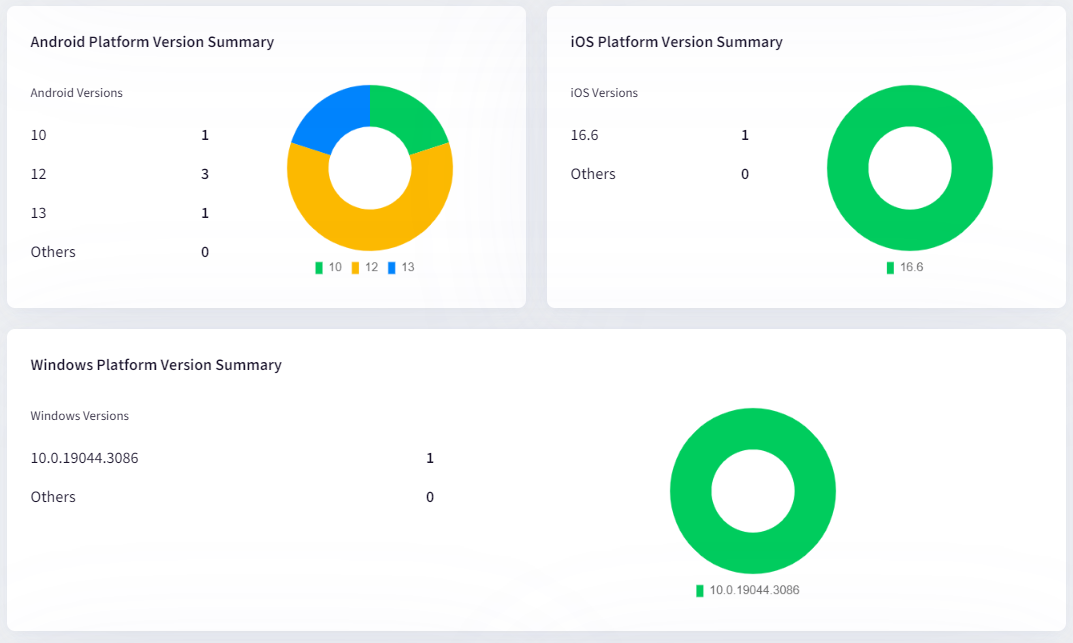
- Shows a graphical representation of different OS versions of the managed devices belonging to different platforms.
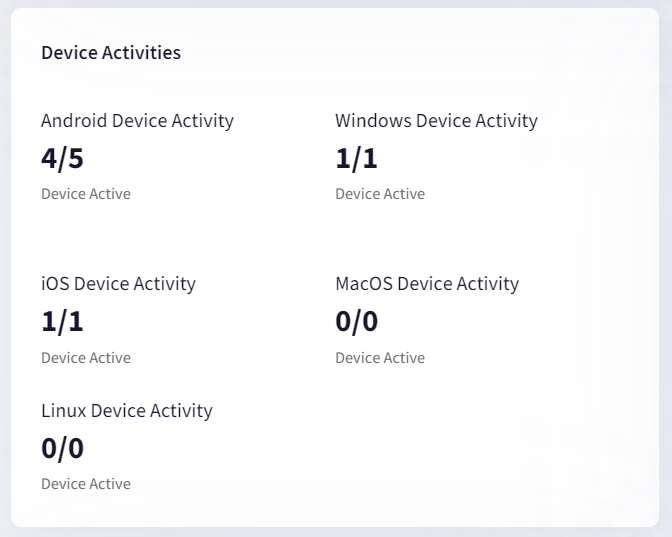
- Device Activities: Shows the platform vise details of the active devices.
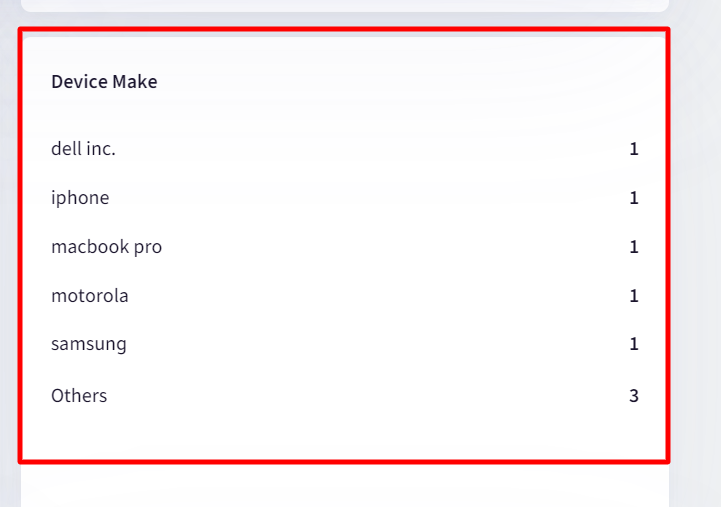
- Device Make: Shows the device made of the enrolled devices. Clicking on the device make name will redirect you to the Devices section showing the concerned device.
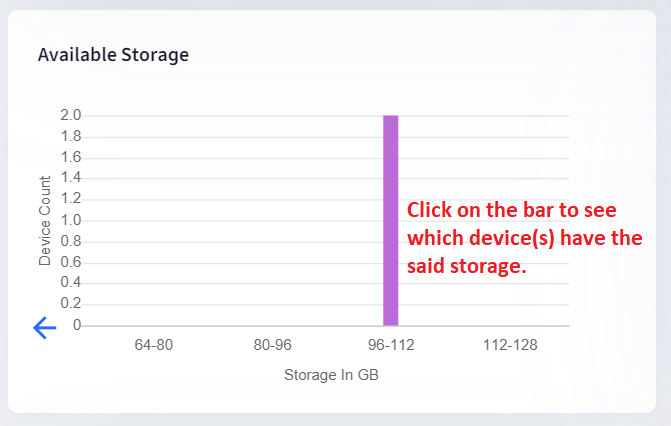
- Available Storage: Shows a graphical representation of the collective Internal storage (in GB) of all the managed devices.
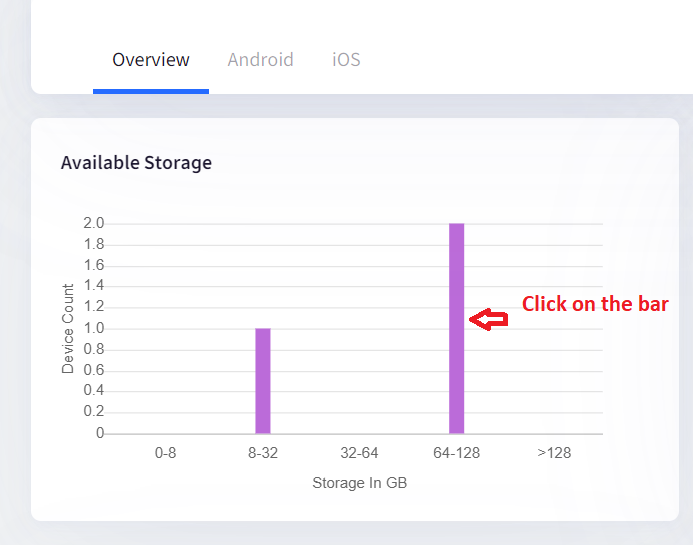
- Clicking on the bar will show another graph of the storage, and clicking on that bar will redirect to the Devices section showing the device(s) having the said storage.
- Clicking on the bar will show another graph of the storage, and clicking on that bar will redirect to the Devices section showing the device(s) having the said storage.
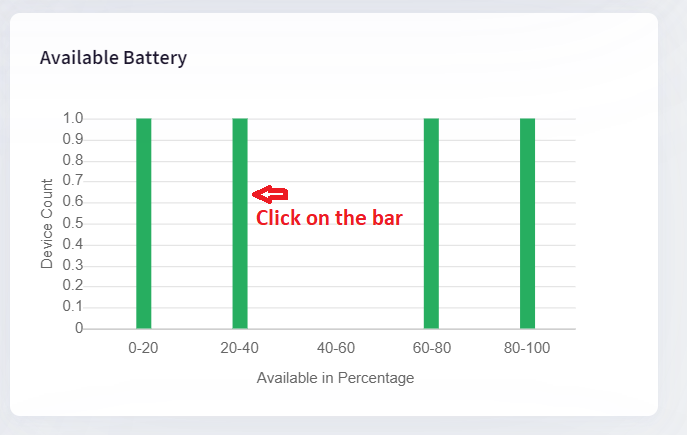
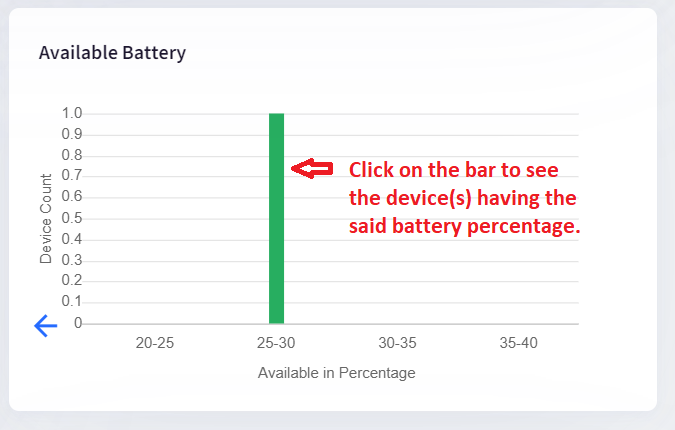
- Available Battery: This shows a graphical representation of the available battery of the managed devices.
- Clicking the bar will show another graph of the available battery, and clicking on that bar will redirect to the Devices section showing the device(s) having the said battery.
- Clicking the bar will show another graph of the available battery, and clicking on that bar will redirect to the Devices section showing the device(s) having the said battery.
Compliance Violations
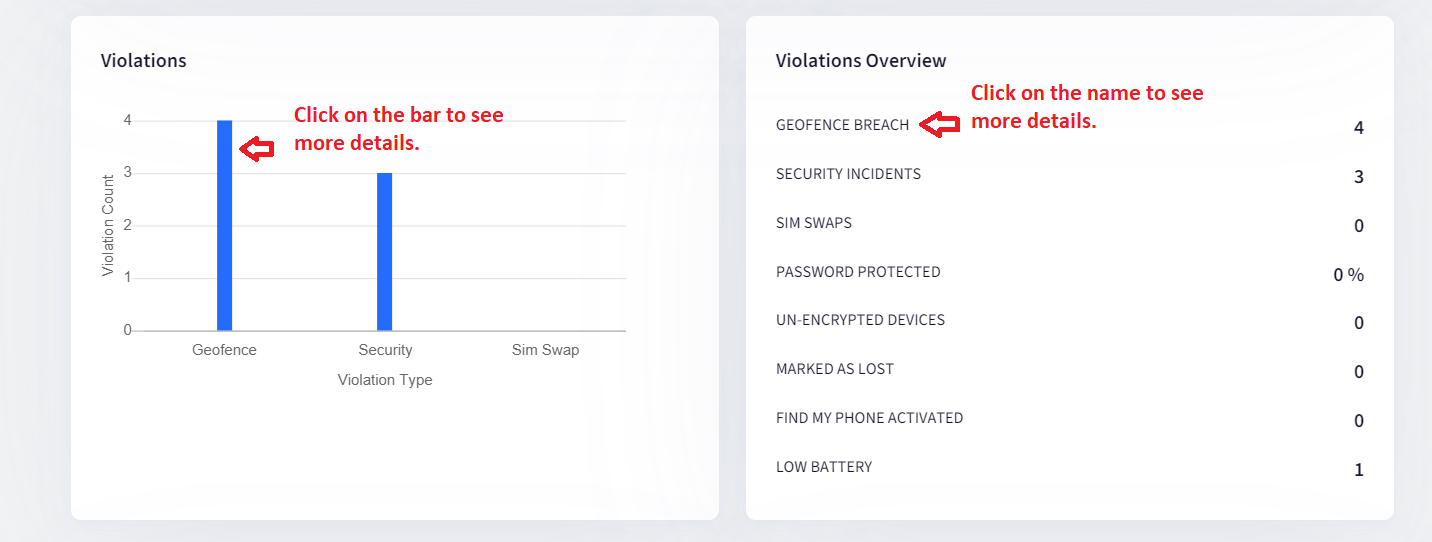
- Violations: Shows a graphical representation of the Compliance violation eg. Geofence compliance and other Security incidents eg. Failed to unlock attempts and SIM swaps, etc. Clicking on the respective bars will show further details of the compliance violations.
- Violation Overview: This will show an overview of the number of violations that have happened. Clicking on the respective violations will redirect you to the details of the respective violation.
 Note:
Note:
Data Details
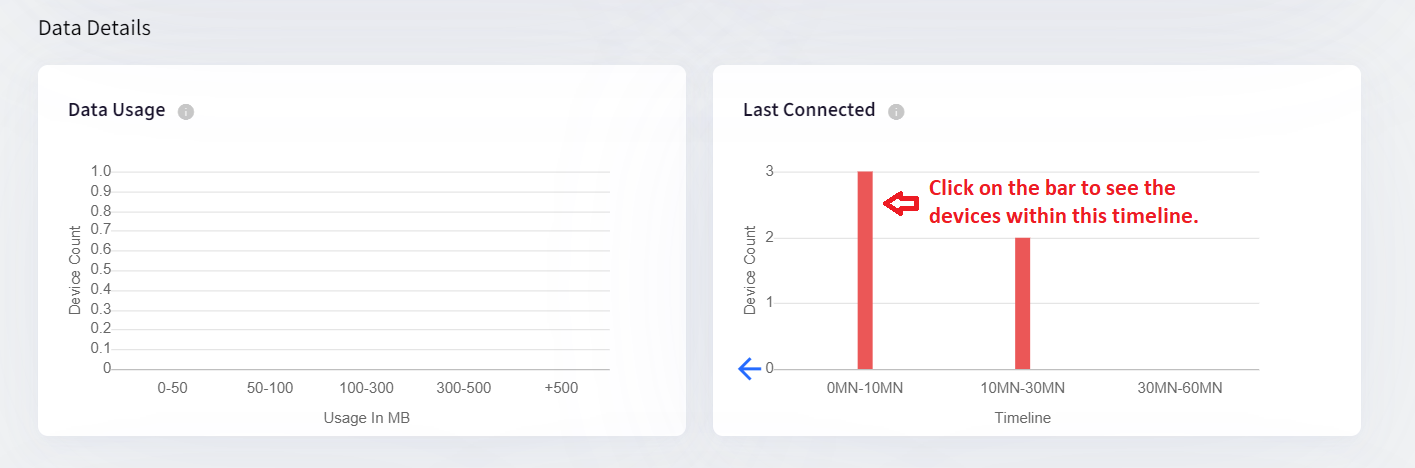
- Data usage: This shows the graphical representation of the data used by the managed devices.
- Last Connected: This shows the graphical representation of the managed devices that periodically sync with the Scalefusion dashboard.
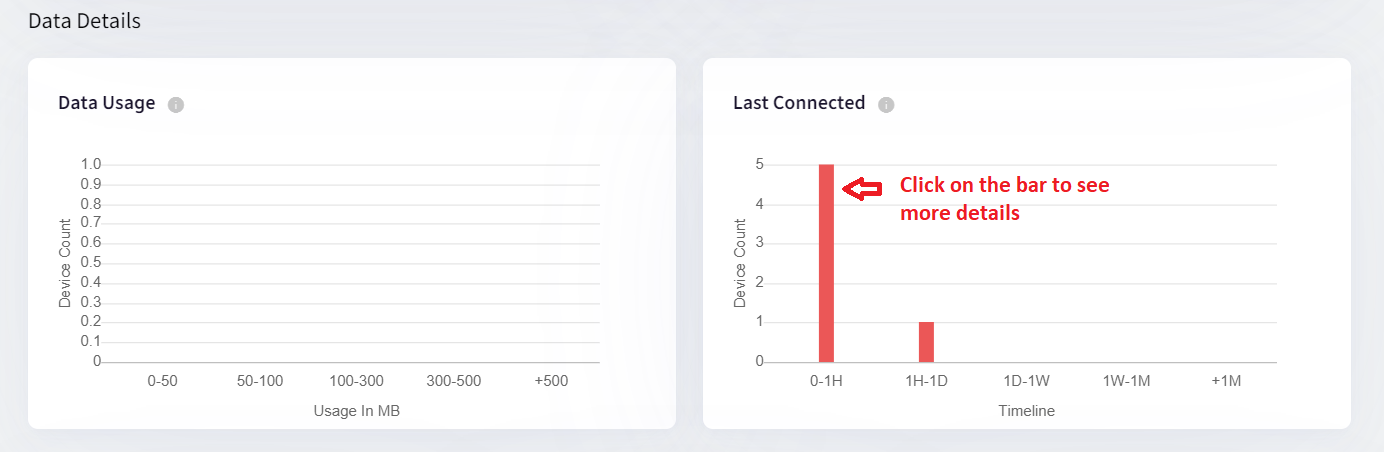
- Clicking on the bar will show another graph of the Last connected timeline, and clicking on the bar here will redirect you to the Devices section, where you will see the device(s) showing within that timeline.
- Clicking on the bar will show another graph of the Last connected timeline, and clicking on the bar here will redirect you to the Devices section, where you will see the device(s) showing within that timeline.
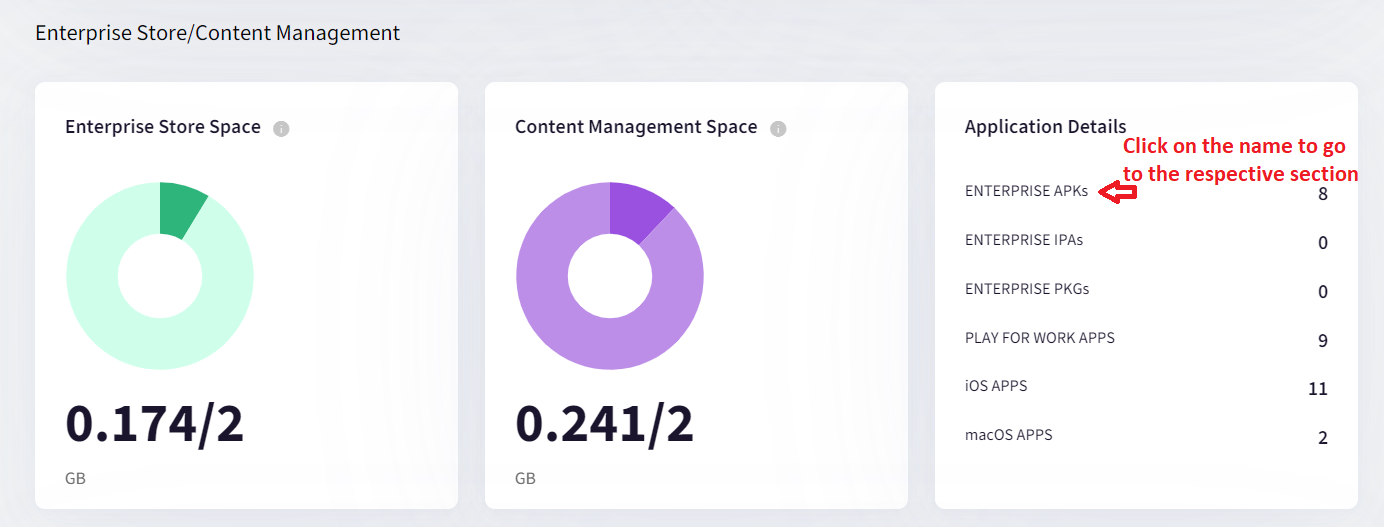
Enterprise Store/Content Management
- Enterprise Storage Space: Shows the available and used Enterprise Store space.
- Content Management Space: Shows the available and used Content Management space.
- Application Details: Shows an overview of the number of Enterprise APKs, Play for Work Apps, iOS Apps, etc., uploaded to the Scalefusion dashboard.
- Clicking on the respective name will redirect to the respective section on the dashboard.
- Clicking on the respective name will redirect to the respective section on the dashboard.
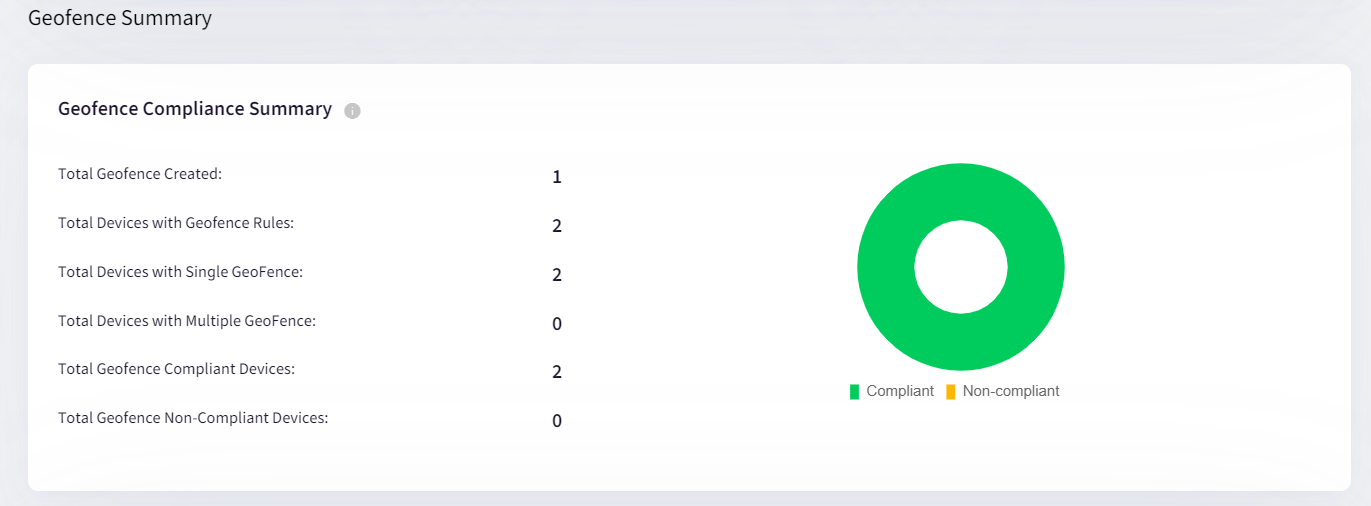
Geofence Summary
- Geofence Compliance Summary: This shows the overview of the number of Geofences created and the number of Geofence compliant devices.
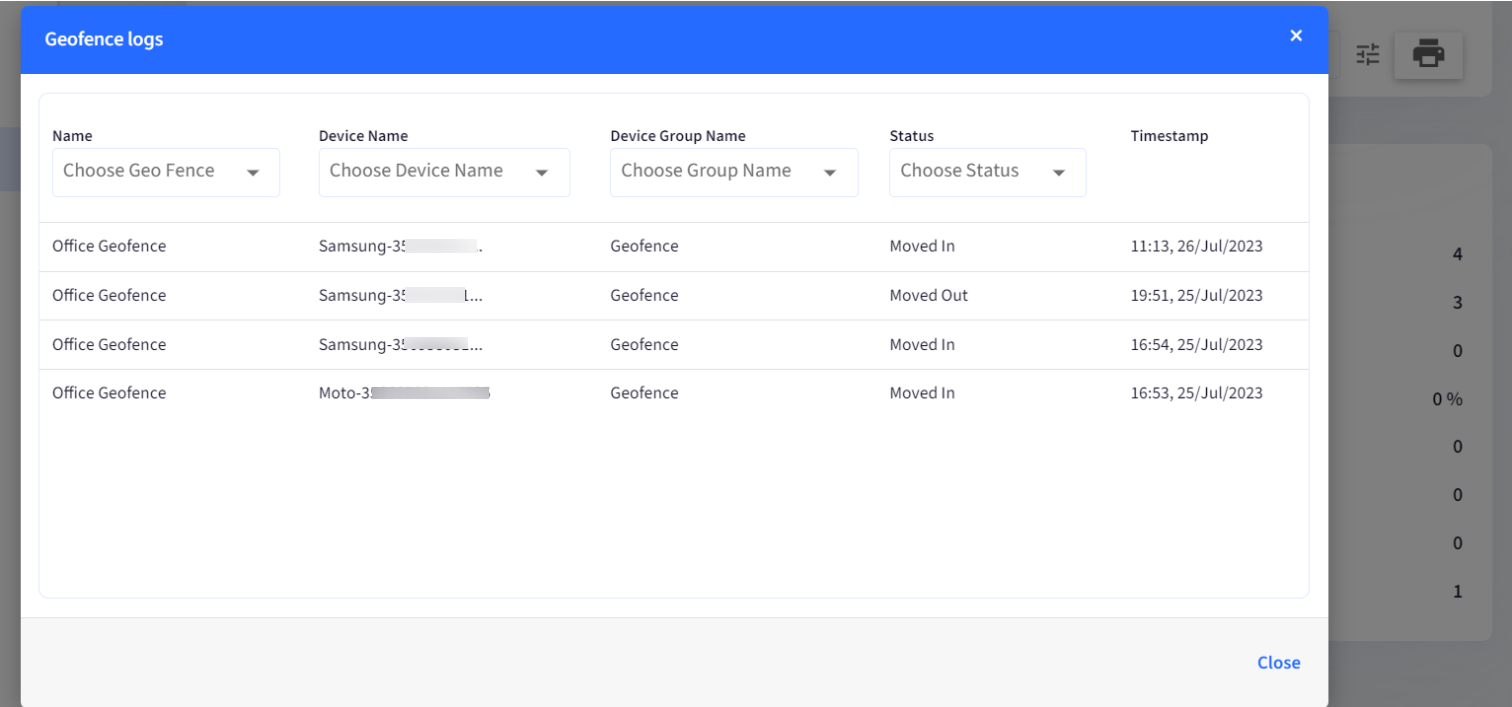
- Geofence Compliance Details: Shows a detailed view of the Geofence(s) with device statuses.
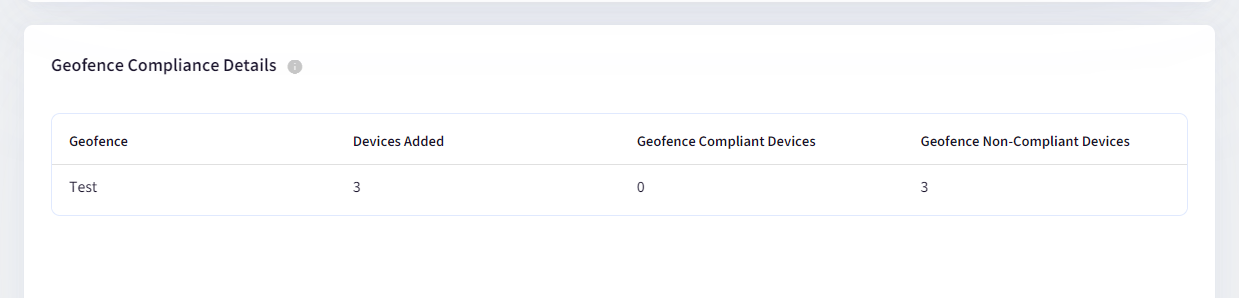
- Clicking on the Geofence name will show the Geofence logs.
