The Overview section provides a centralized view of your organization's Apple OS update status. It helps administrators quickly assess device compliance, monitor update deployments, and identify devices that require attention.
The dashboard combines device metrics, deployment statistics, update availability information, and operational insights into a single view, making it easier to track the overall health of update management across managed devices.
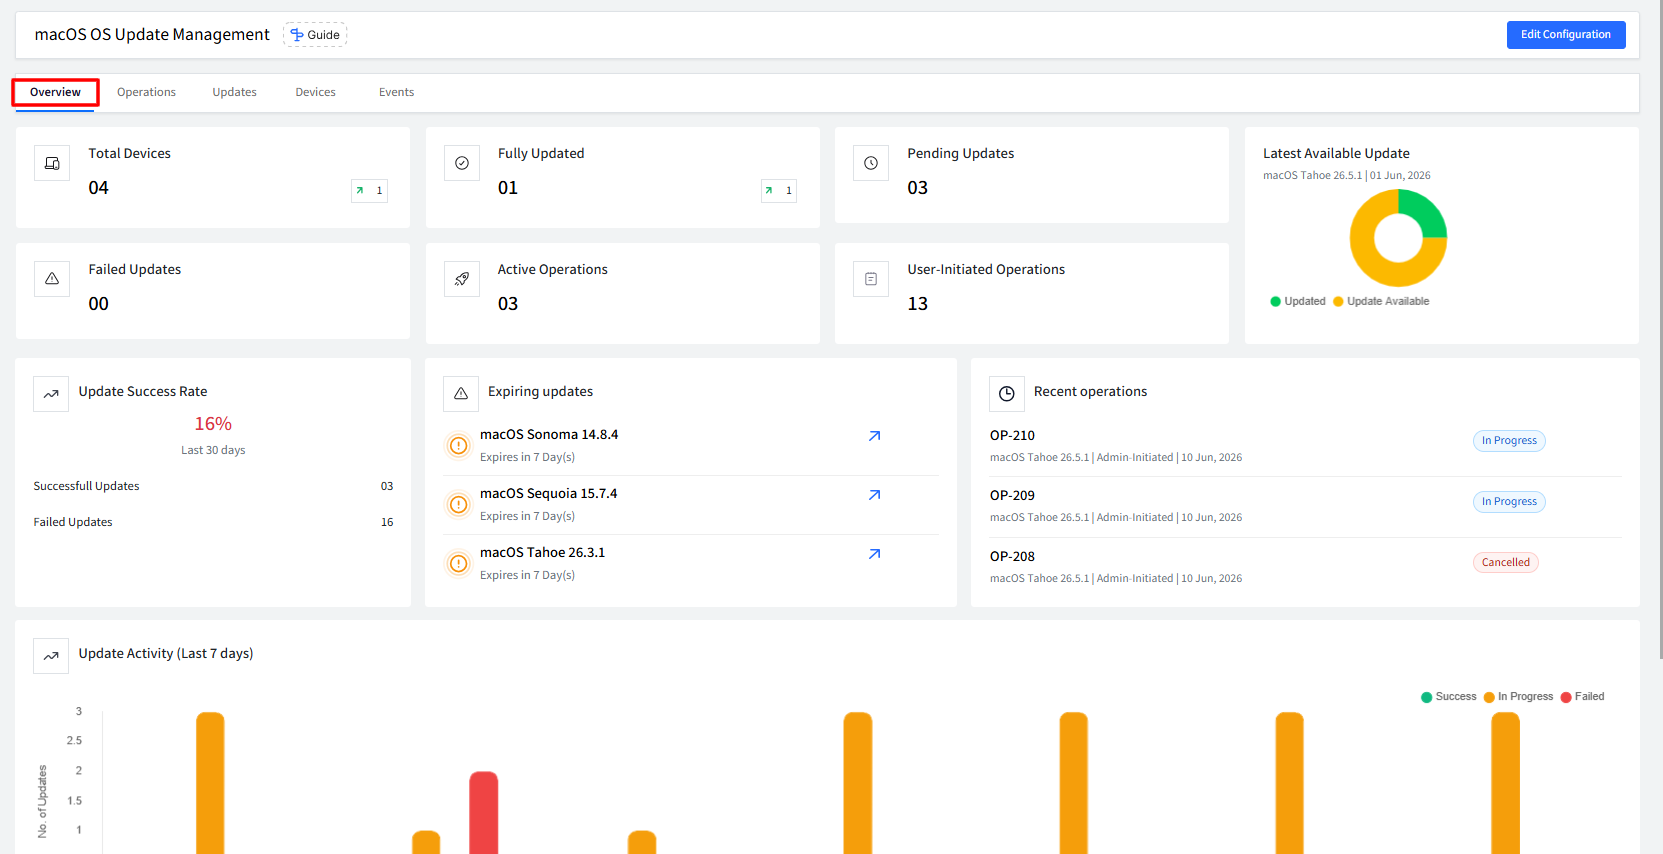
Devices and Update Metrics
The top section of the dashboard displays key metrics that provide a snapshot of your update environment.
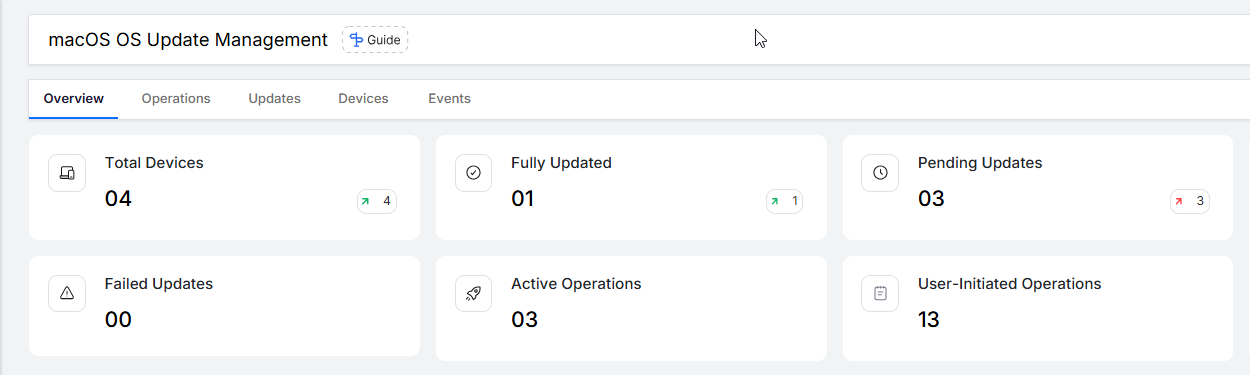
Total Devices: Displays the total number of managed devices included in OS Update Management.
Fully Updated: Displays the number of devices currently running the latest available operating system version.
Pending Updates: Displays devices that have one or more available updates that have not yet been installed.
Failed Updates: Displays devices where update installation did not complete successfully and may require administrator attention.
Active Operations: Displays update deployment operations that are currently in progress across the device fleet.
User - Initiated Operations: Displays update installations initiated by end users through the update catalog or self-service experience.
Clicking on each card takes you to the respective tab for viewing more details
Latest Available Update
The Latest Available Update widget provides a quick overview of the most recent operating system update currently available for deployment.
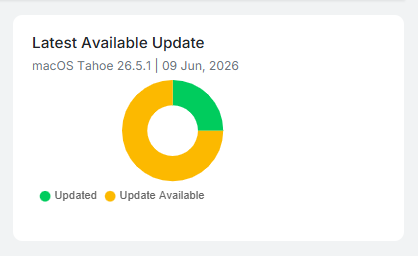
The widget displays:
Latest available OS version.
Release date of the update.
Devices already running the latest version.
Devices that still require the update.
The visual distribution chart provides an at-a-glance view of update adoption across the device fleet.
Administrators can use this information to:
Assess rollout progress.
Measure update adoption rates.
Identify how many devices remain behind the latest release.
Prioritize deployment activities when adoption levels are low.
Update Success Rate
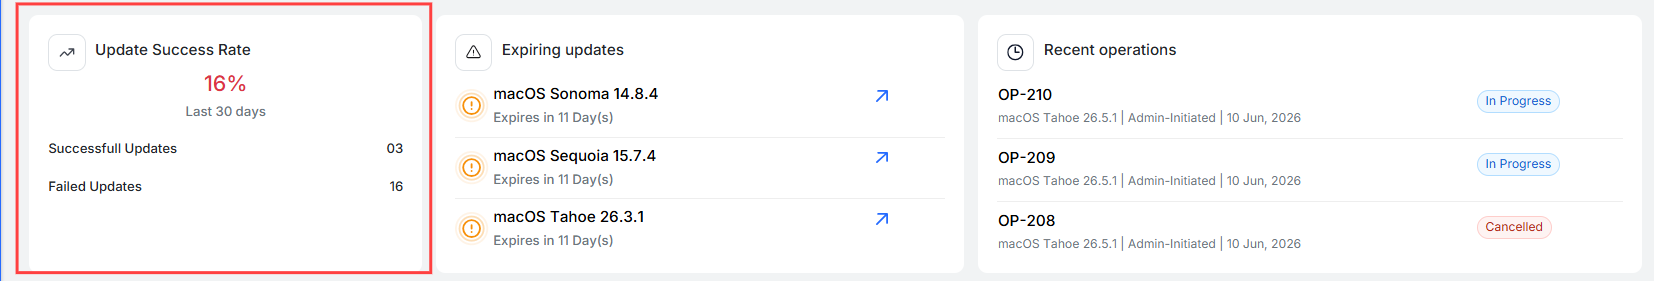
The Update Success Rate widget provides a summary of update deployment outcomes over the last 30 days.
The widget tracks:
Successful update installations.
Failed update installations.
Overall success percentage.
This metric helps administrators evaluate the effectiveness of their update deployment strategy and identify trends that may require further investigation.
Consistently high success rates indicate healthy deployment processes, while lower success rates may suggest environmental, device, or configuration issues requiring attention.
When no deployment activity exists during the selected period, the widget displays a no-data state.
Expiring Updates
The Expiring Updates section highlights operating system updates that are approaching their expiration date.
Apple periodically removes older update packages from availability. Once an update expires, it can no longer be deployed to devices.
For each update, administrators can view:
Update name and version.
Remaining time before expiration.
Quick access to update details.
Monitoring expiring updates helps organizations:
Prevent missed deployment opportunities.
Prioritize rollout of time-sensitive updates.
Ensure devices receive critical updates before they become unavailable.
Recent Operations
The Recent Operations widget displays the most recently created update deployment operations.
Each entry provides a quick summary of deployment activity, including:
Operation ID.
Operating system version.
Deployment type.
Creation timestamp.
Current operation status.
This section provides administrators with immediate access to ongoing and recently completed deployments without navigating to the Operations tab.
Recent Operations can be used to:
Verify newly created deployments.
Review recent administrative actions.
Quickly investigate deployment activity.
Access operational details for troubleshooting.
When no deployments have been created, the widget provides a shortcut for creating a new operation.
Update Activity (Last 7 Days)
The Update Activity chart provides a visual representation of update deployment activity during the previous seven days.
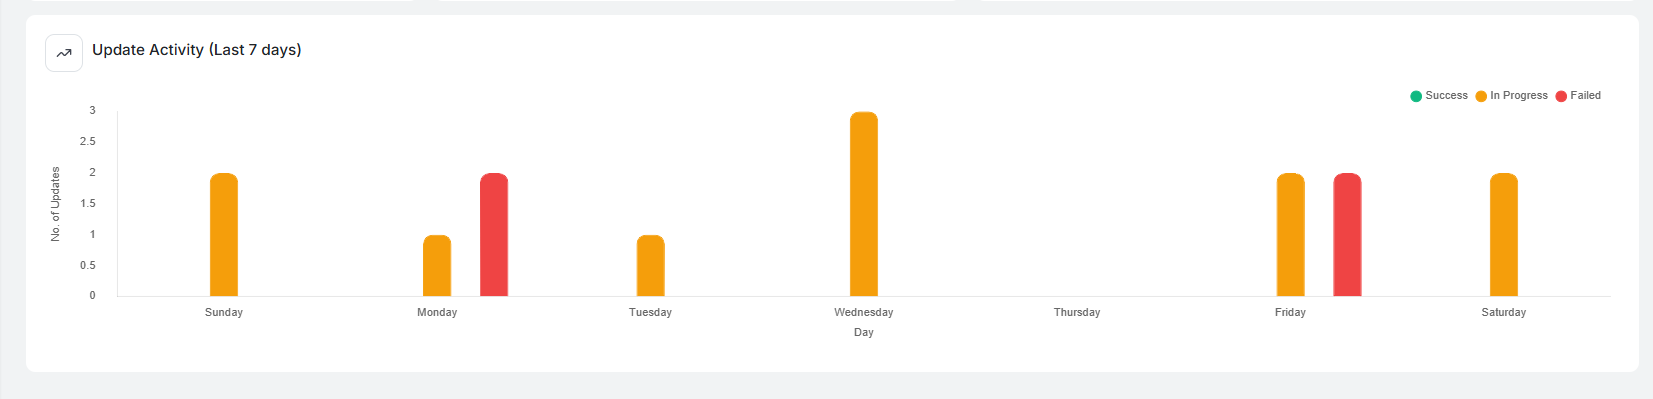
The chart categorizes update activity into:
Successful updates.
Updates currently in progress.
Failed updates.
This visualization enables administrators to identify deployment trends and monitor update activity over time.
Common use cases include:
Measuring deployment volume.
Tracking operational workload.
Identifying spikes in update activity.
Detecting recurring deployment failures.
Monitoring the effectiveness of update rollout schedules.
By reviewing update activity trends, administrators can better understand how updates are being deployed throughout the organization and make informed decisions regarding future deployment strategies.