Scalefusion offers Content Management, which allows admins to push files to remote devices. This is enabled through the FileDock application. FileDock Reports provide an analysis of such files once they are being pushed onto devices.
This document gives a description of all such reports.
Who can access
The reports are tied up to the plan that a customer purchases. If FileDock is enabled on the user's account, then FileDock reports will be accessible to him/her.
In this series, we have the following report:
FileDock Analytics
FileDock Analytics report provides analysis of the files being pushed to remote devices through Content Management. It gives an insight into how the content is being consumed with the help of various analytics such as Downloads, Failed Downloads, File Usage, and Presentations.
Platforms
- The FileDock Analytics report is available for Android, iOS, macOS and Windows devices.
Pre-requisites
- For macOS, Scalefusion-MDM Client (Agent application for Mac devices) should be installed on Mac devices.
How to access
- Sign in to Scalefusion Dashboard
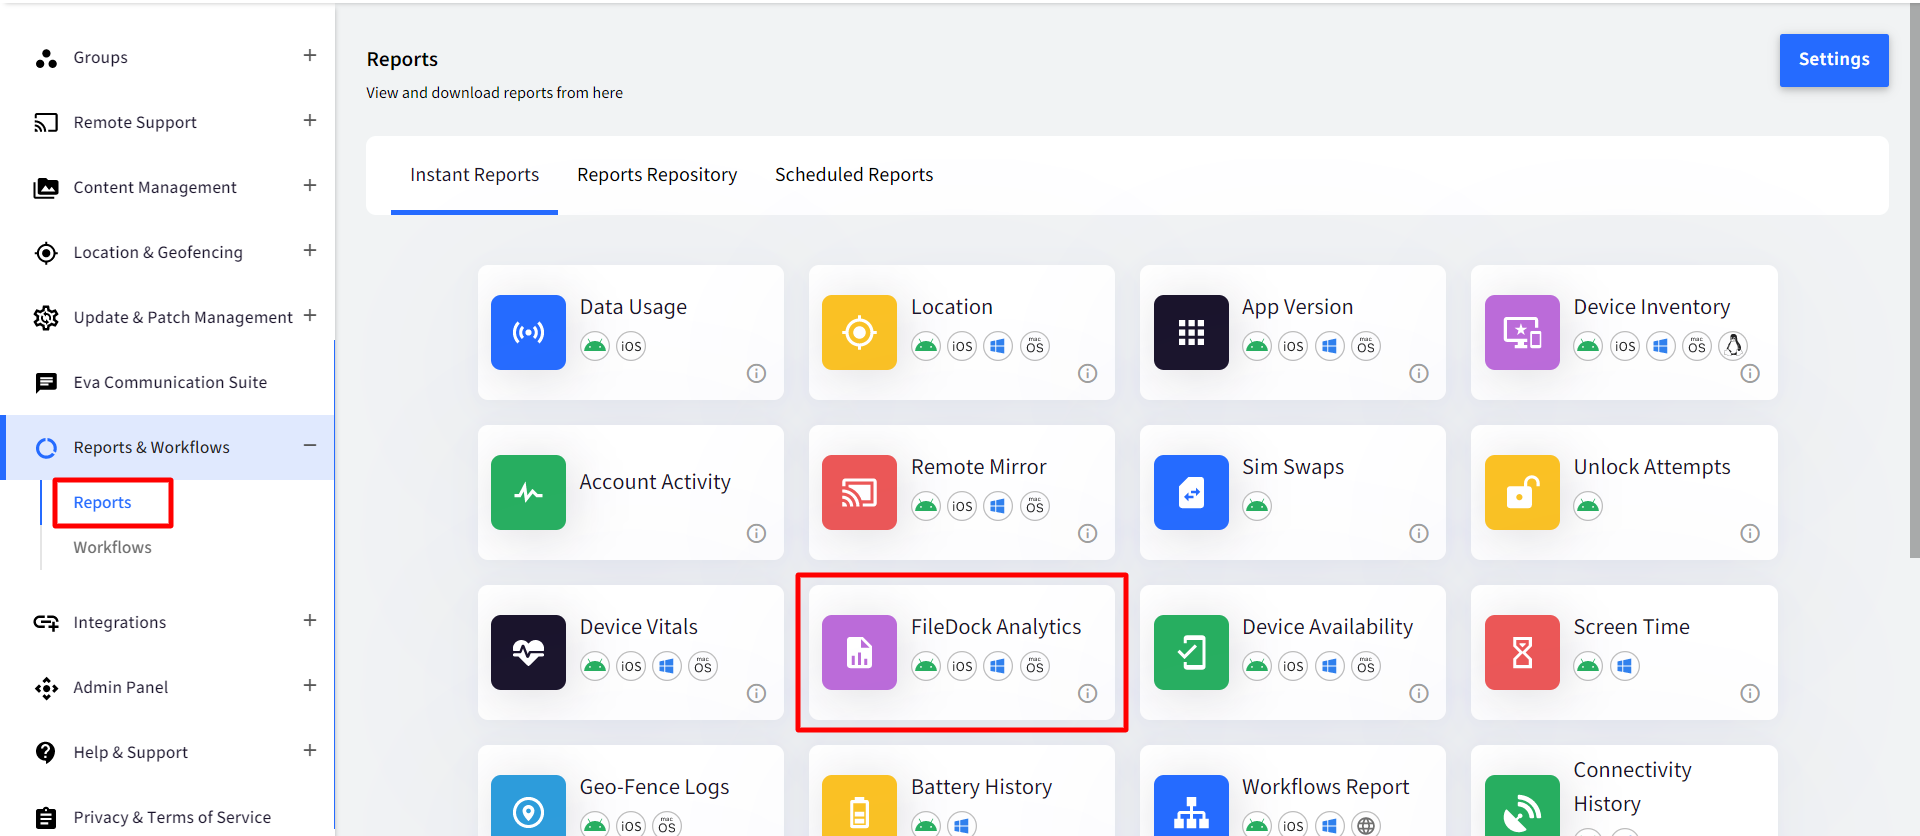
- Navigate to Reports & Workflows > Reports
- Click on FileDock Analytics
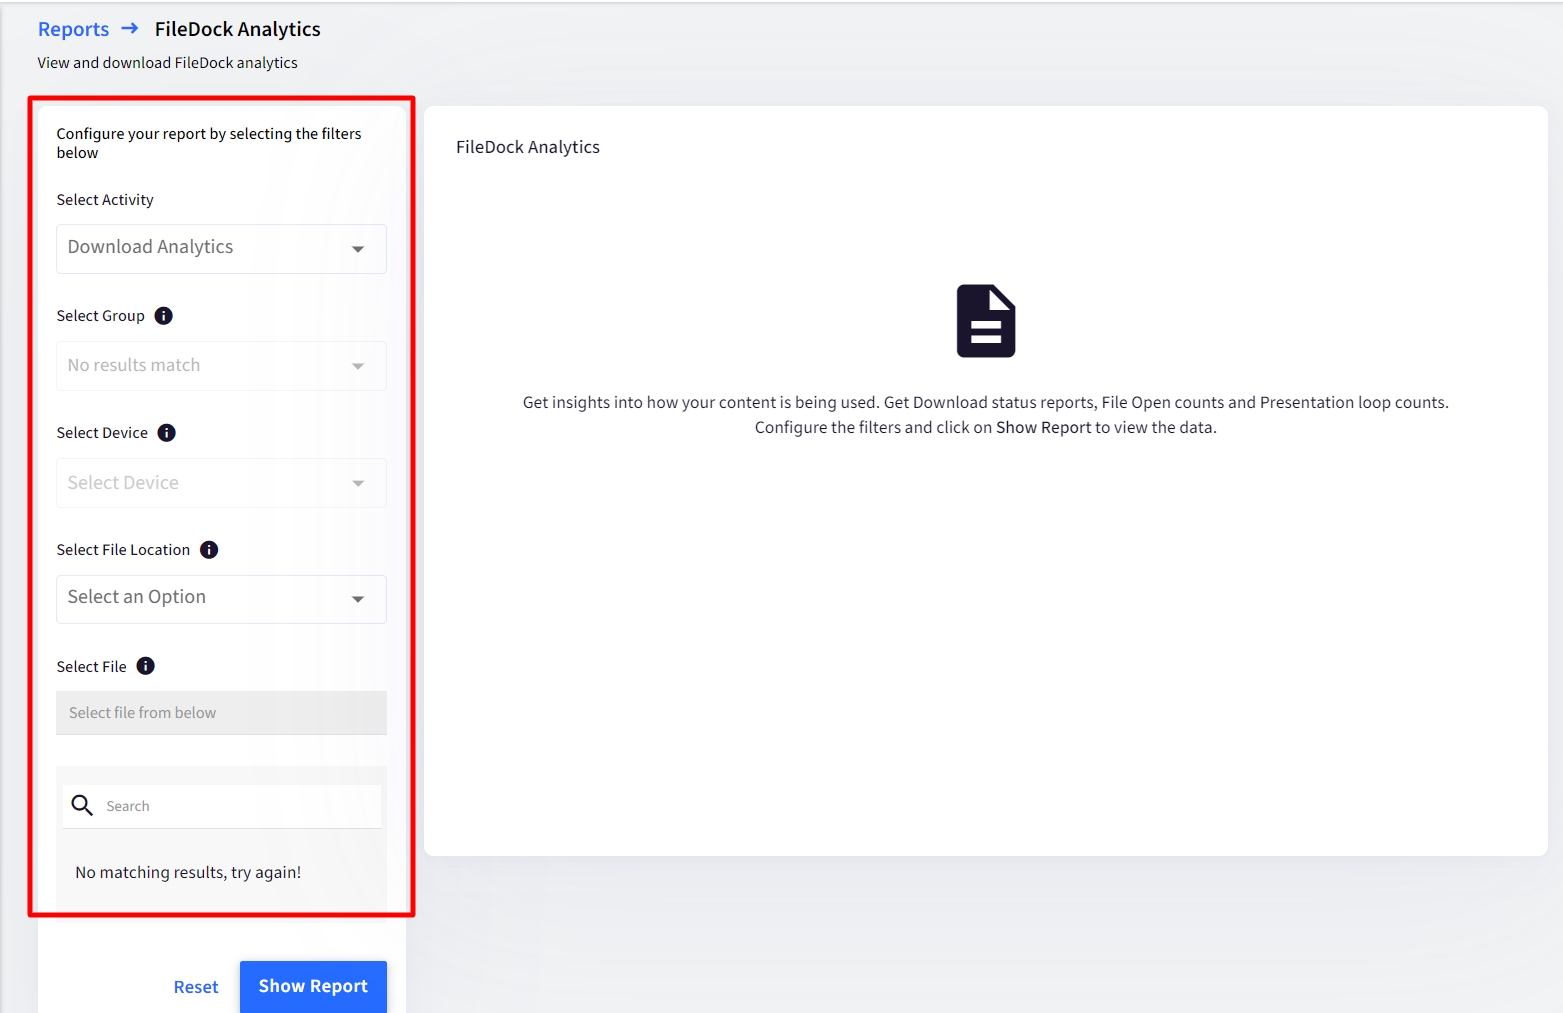
- Select Filters to configure your report:
Filters Description Select Activity From the following analytics, select the one on which you want the analysis: - Download Analytics: Gives the download status information for all the files published to the devices in a group.
- Failed Download Analytics: Provides a list of files that could not be downloaded, along with the reason.
- File Usage Analytics: This lets you analyze how the files you pushed are being used
- Presentation Analytics: Gives details on how many times a presentation was looped. This applies only to Digital signage mode
- Presentation Touch Analytics: Gives details on touch/click behavior on presentations
- Screensaver Touch Analytics: touch/click behavior on presentations used as screensavers
Presentation Analytics and Presentation Touch Analytics will not show up for macOS devices.Select Group Lists Device Groups and Sub-Groups. More than one group can be selected Only the groups where Files or Presentation(s) have been published are listed hereSelect Device Lists all the devices that have FileDock installed. If a Group is selected, then it lists only the devices (having FileDock installed) in that group. Select a device. Select File Lists all the files published to all Groups/Devices or selected group(s)/device(s). Select a file - After selecting filters, click on Show Report
Reports Output
Based on analytics selection (Select Activity filter), the report gets generated, each with a different set of details. Let's understand the information you get on selecting each.
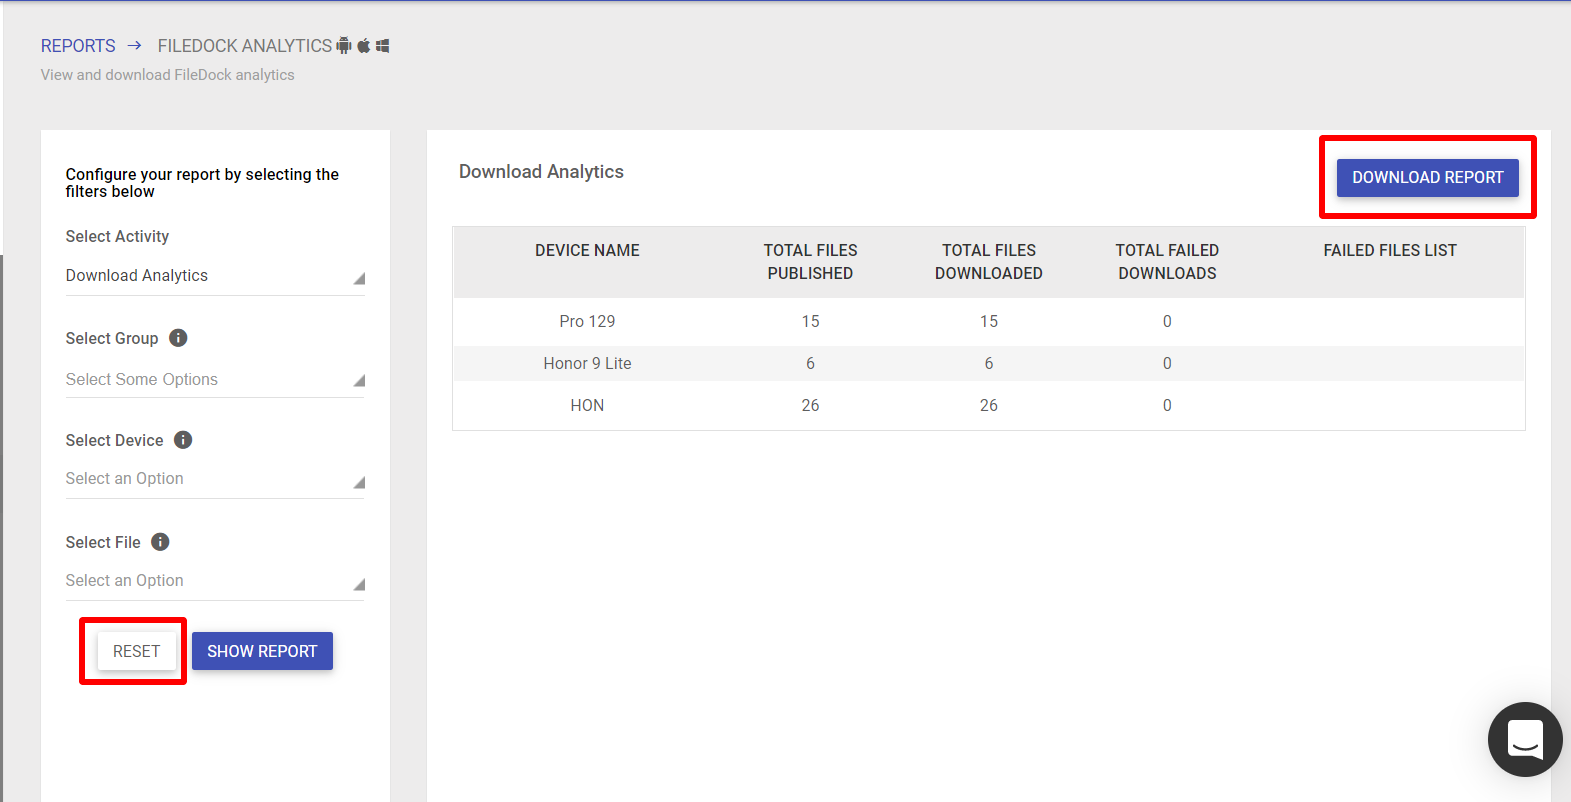
Download Analytics
Download Analytics gives an account of files pushed from Dashboard, providing the download status information for all the files published to the devices in a group or on individual devices. As a result, the following details show up:
- Device Name: Name of the device on which file(s) are published
- Total Files Published: No. of files currently published to the device
- Total Files Downloaded: No. of files downloaded on the device after being published. This number is updated on the Dashboard after syncing analytics on the device.
- Total Failed Downloads: No. of files that have failed to download
- Failed Files List: List of files that have failed to download. If there are more than 2 files, the count of files is shown and clicking on the count shows a dialog that displays the list of files that have failed to download.
Hence, the report gives a summarized view of the total published files on the device and, out of them, how many have successfully downloaded and how many have failed.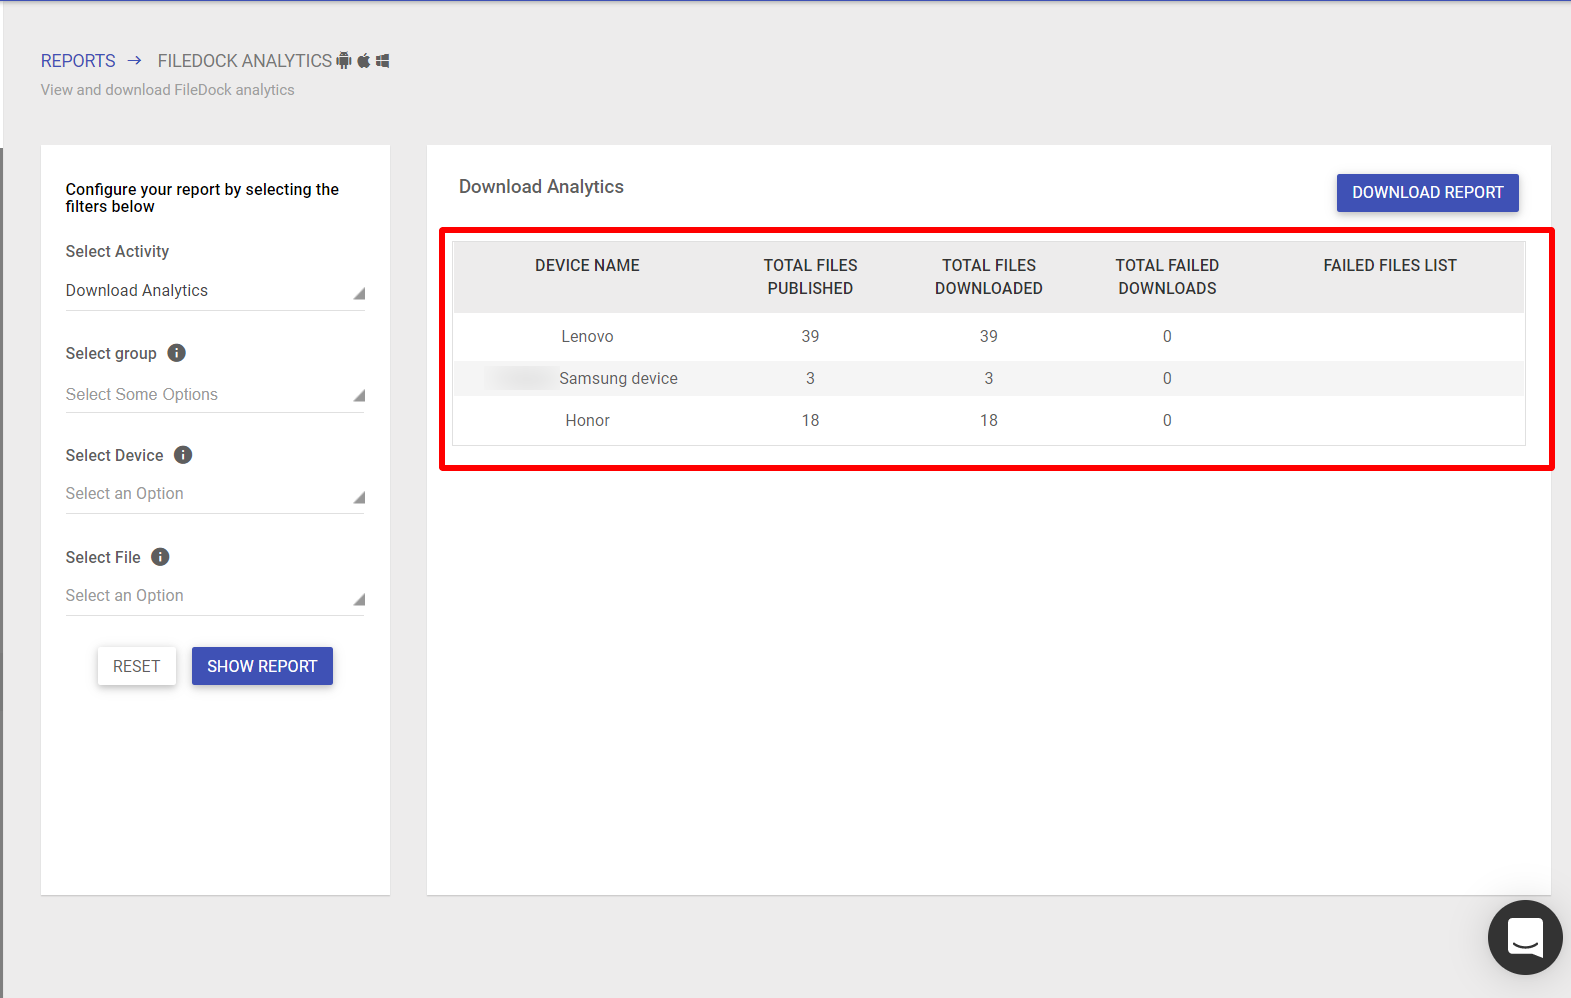
Failed Download Analytics
Failed Download Analytics provides a list of files that could not be downloaded.
The following details show up:
- Device Name: Name of device on which file(s) are published and downloaded
- File Name: Name of the file that failed to download
- Failure Reason: Gives reason why file failed to download
- Retry Count: No. of retries that were done to download the file
Thus, the report lets you analyze the failure reasons for download, which can be timely acted upon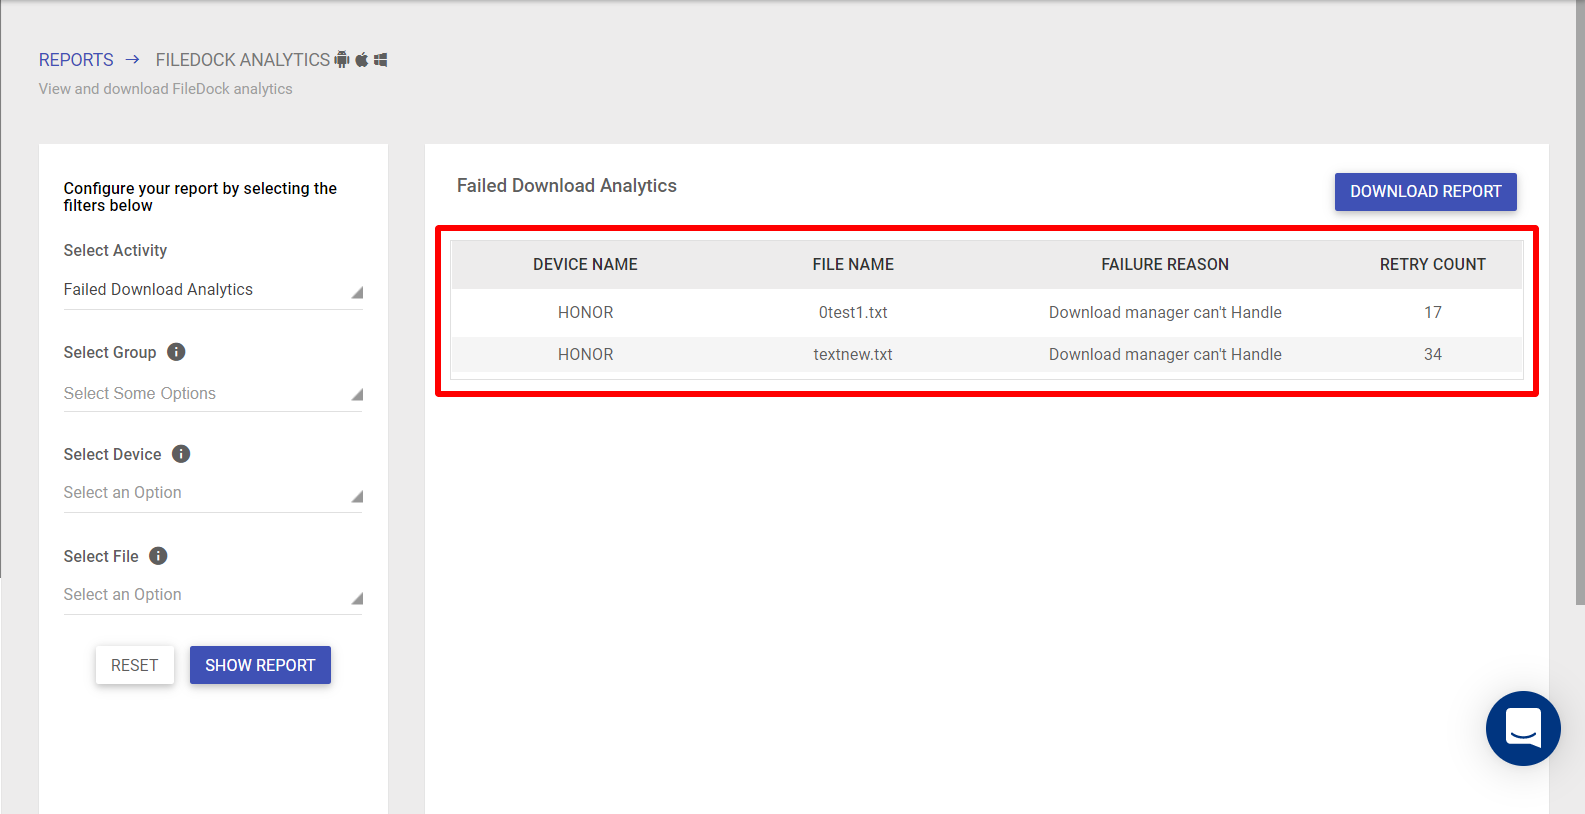
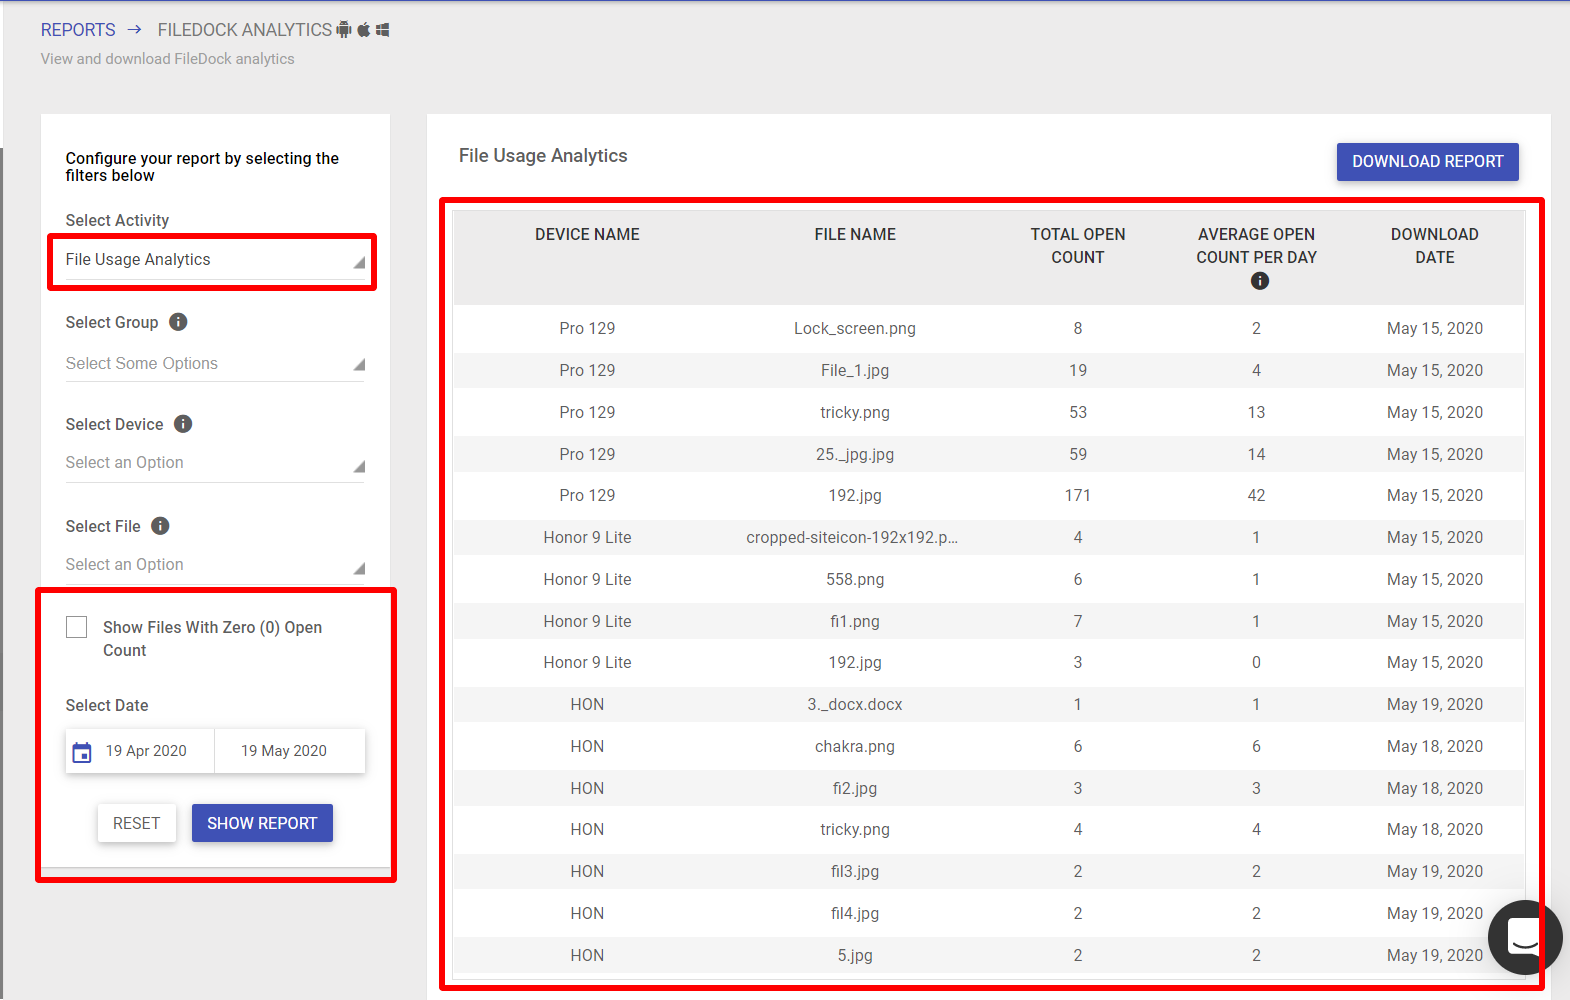
File Usage Analytics
File Usage Analytics provides an analysis of how the files you pushed are being used, with the following details:
- Device Name: Name of the device on which file(s) are published
- File Name: Name of file for which usage is calculated
- Total Open Count: No. of times the file was opened
- Average Open Count per day: No. of times the file was opened per day, on an average
- Download Date: The date on which the file was downloaded
There are two additional filters for File Usage Analytics, viz:
- Show Files with Zero (0) Open Count: If checked, the report will also show files that have not been opened even once (count is 0)
- Select Date: Select the date range for which you want to check file usage
All this information lets the admin judge the usage patterns of files by users.
Presentation Analytics
Presentation analytics lets you look at the total play count and the average play count of presentations per day. Gives details on how many times a presentation was looped. This applies only to Digital signage mode.
As a result, the following details show up:
- Device Name: Name of the device on which the Presentation is published
- Presentation Name: Name of the Presentation
- Presentation Ready: Total No. of files in the Presentation
- Total Play Count: No. of times the Presentation was looped
- Average Play Count Per Day: On average, no. of times the presentation is played per day
- Published Date: The date on which the Presentation was published
There is an additional filter for Presentation Analytics, viz:
- Date Range: This allows you to select the date range for which you want to see the total play count etc.
With this, you can analyze the eyeballs that your presentations are getting.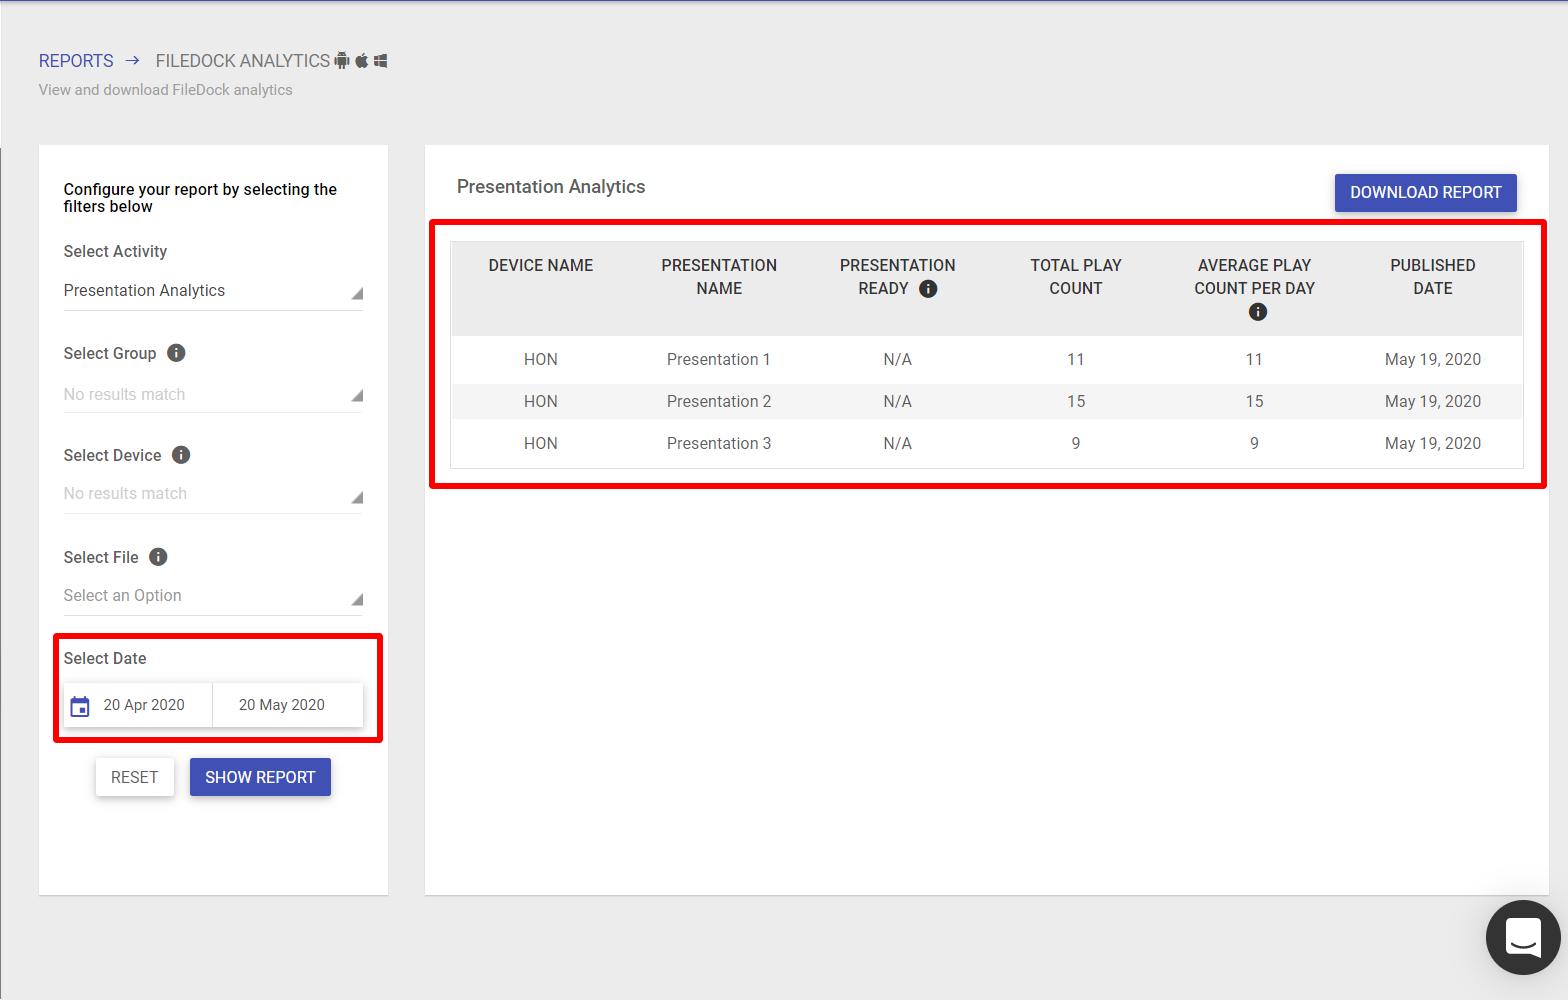
Additional Features
- Download - The reports get downloaded in CSV format by clicking the Download Report button. For each analysis, a separate report can be downloaded.
- Reset filters - The filters selected can be cleared and re-selected. The Reset button clears all filters.
Presentation Touch Analytics
Presentation Touch Analytics captures the touch/click behavior on presentations showing the count of touches/clicks done by the user on any file of the presentation and other related details.
As a result, the following details show up:
- Device Name: Name of the device on which the Presentation is published
- Presentation Name: Name of the Presentation
- File Name: The file in the Presentation which is clicked by the user
- Total Touch Count: Total number of times the file has been touched/clicked by the user
- Date: The date on which the presentation's file has been touched/clicked
There are two additional filters for Presentation Touch Analytics, viz:
- Select Presentation: You can select one particular presentation for which the touch behavior has to be checked
- Date Range: Allows you to select the date range for which you want to see touch behavior
By knowing the touch/click behavior, you can get an overall view of how many people are seeing the presentation.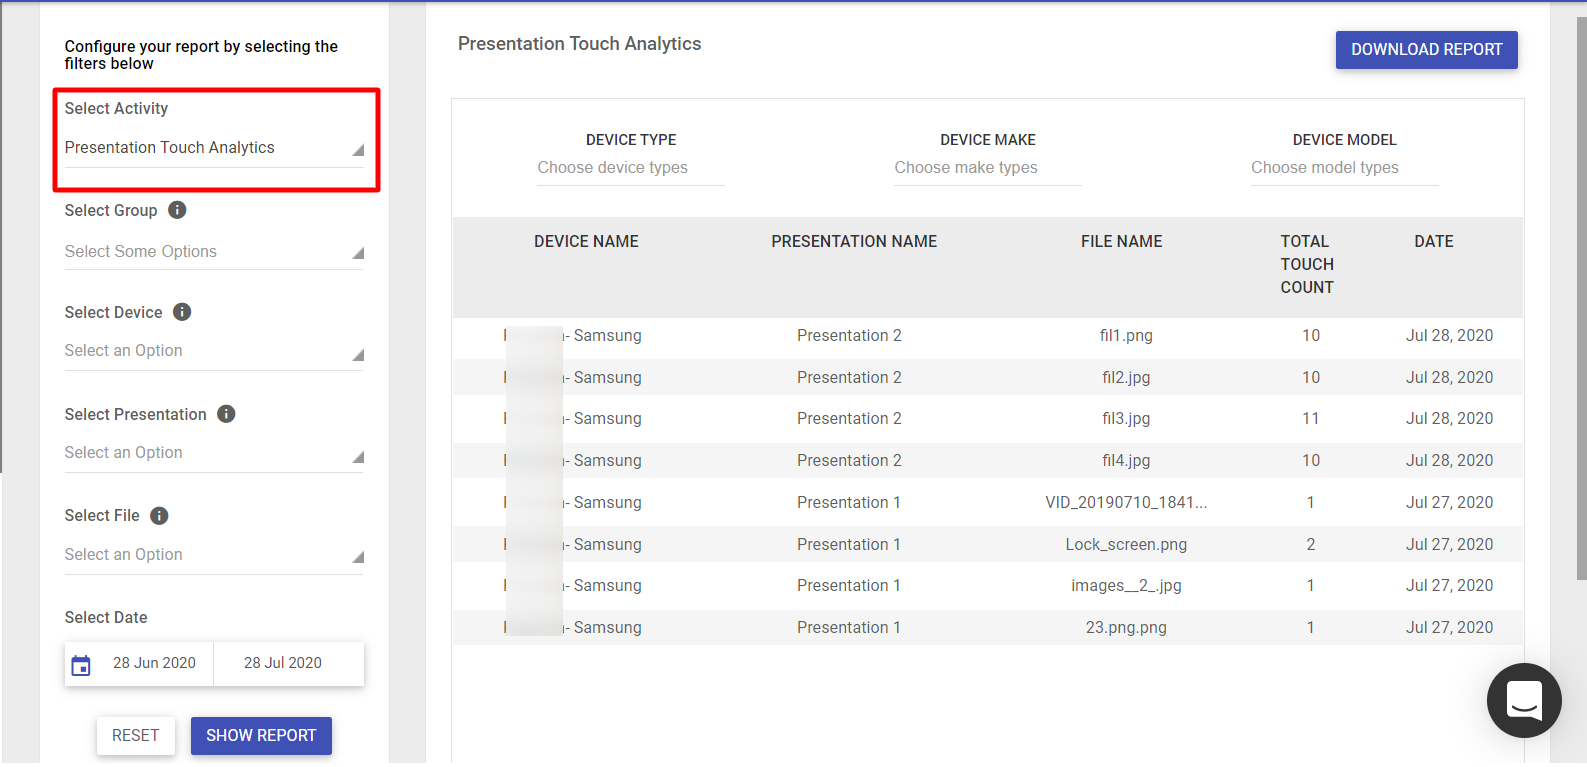
Screensaver Touch Analytics
Screensaver Touch Analytics captures the touch/click behavior of presentations used as Screensaver, showing the count of touches/clicks done by the user on any file of the presentation when it is in screensaver mode, along with other related details.
As a result, the following details show up:
- Device Name: Name of the device on which the Presentation is published
- Presentation Name: Name of the Presentation
- File Name: The file in the Presentation which is clicked by the user
- Total Touch Count: Total number of times the file has been touched/clicked by the user
- Date: The date on which the presentation's file has been touched/clicked
There are two additional filters for Screensaver Touch Analytics, viz:
- Select Presentation: You can select one particular presentation for which the touch behavior has to be checked
- Date Range: Allows you to select the date range for which you want to see touch behavior
By knowing the touch/click behavior, you can get an overall view of how many people are seeing the presentation.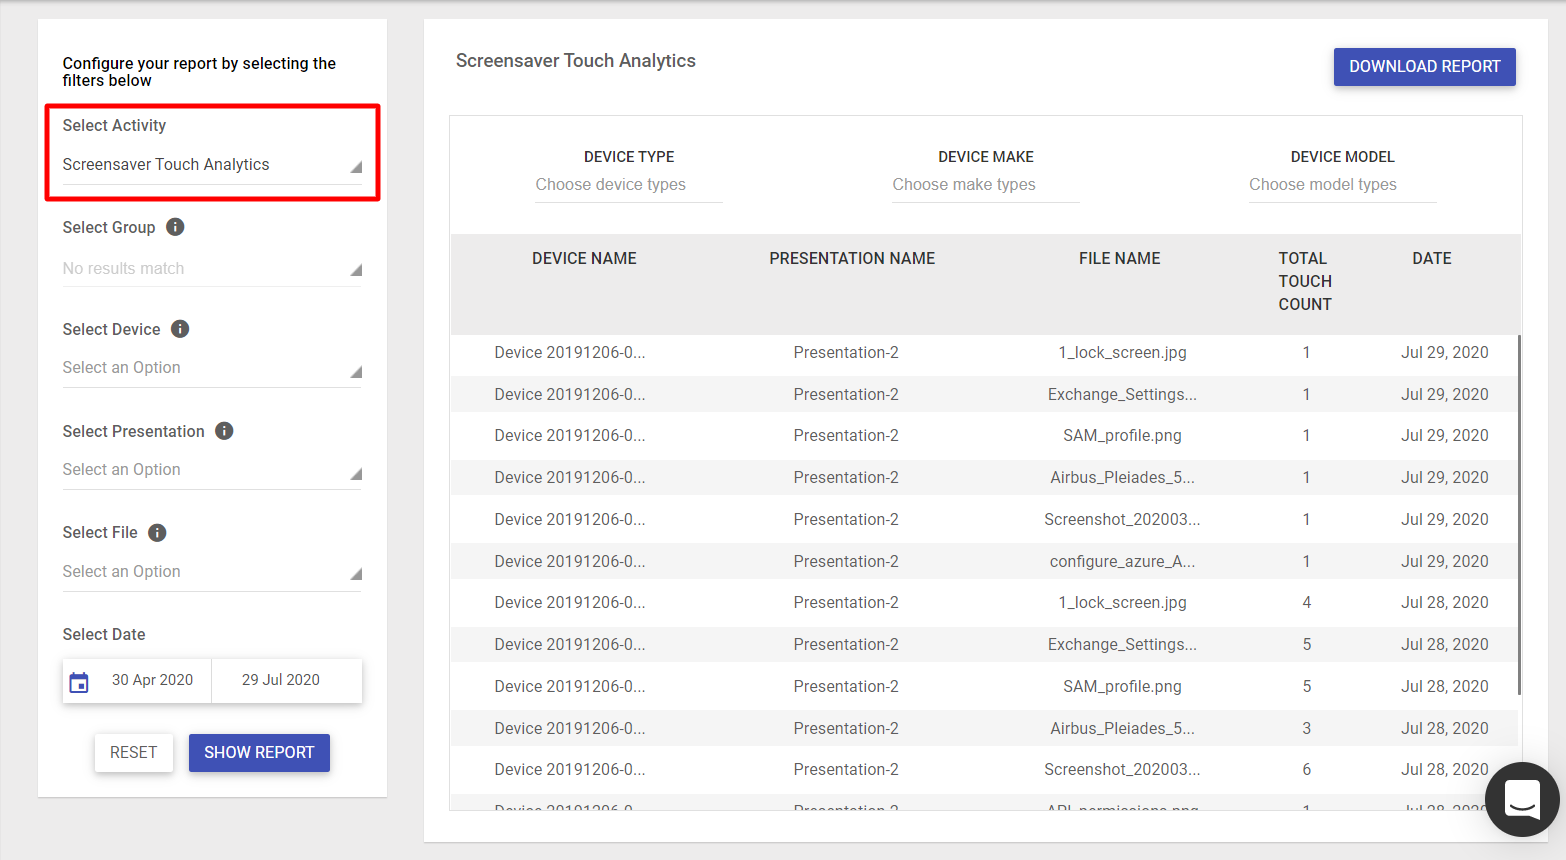
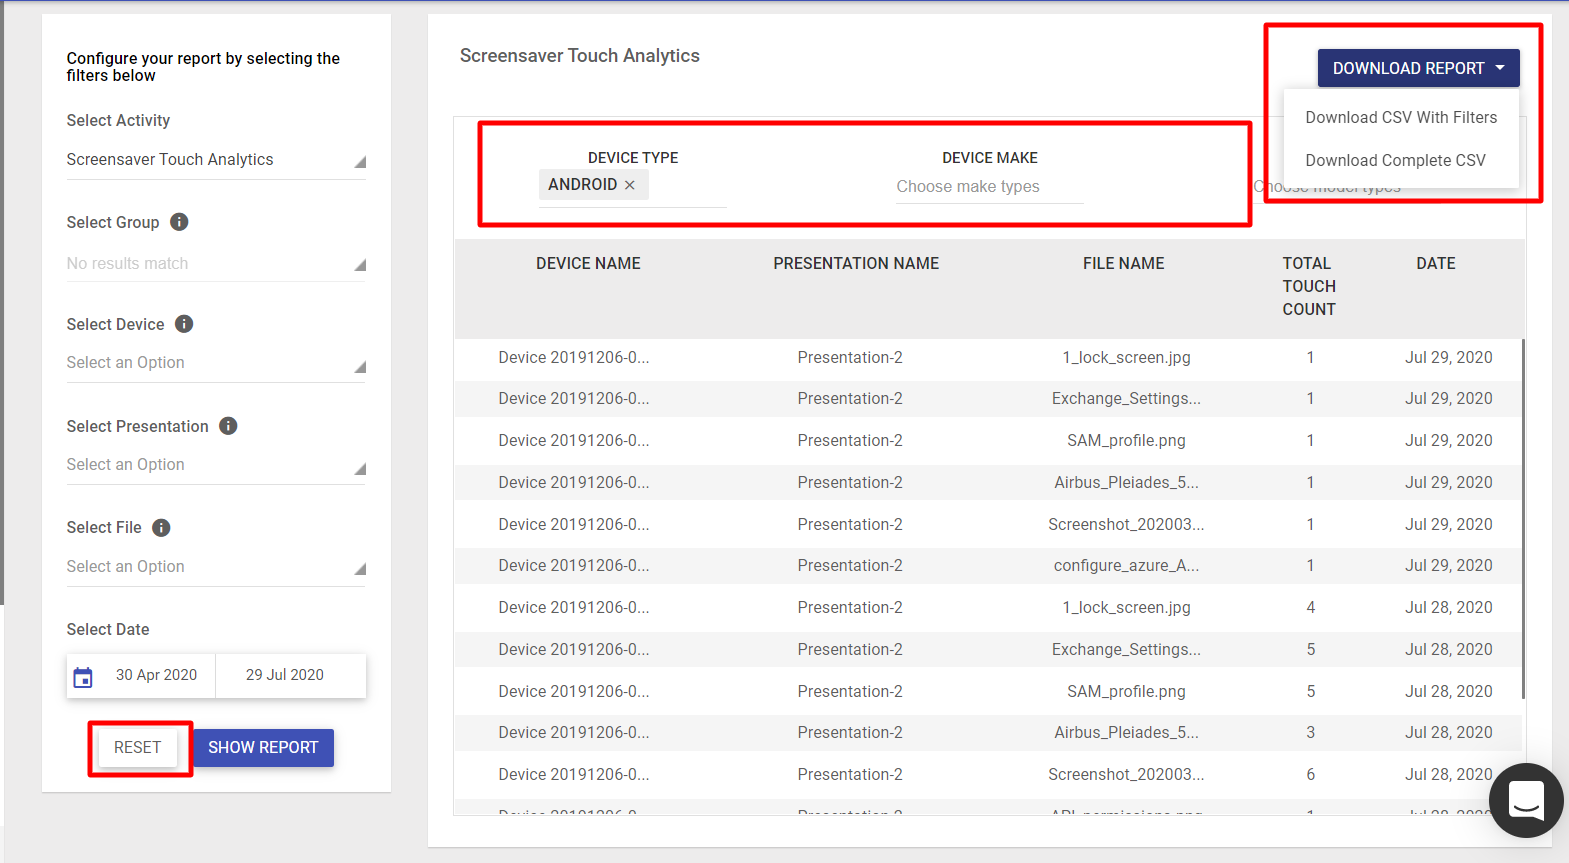
Additional Features
- Filters -There are a few additional device-specific filters on top of the report output with which you can filter the results. They are,
- Device Type: This lets you select the OS type
- Device Make
- Device Model
- Download - The reports get downloaded in CSV format by clicking the Download Report button. For each analysis, a separate report can be downloaded.If you have selected the filters (point #1), you can even download the filtered report by choosing the option Download CSV with filters
- Reset filters - The filters selected can be cleared and re-selected. The Reset button clears all filters.
Known Issues
- A file that is published by the user on a device that has no internet connectivity is not taken into count
- Device search: In the Select Device filter, if a file is positioned lower in the list, then searching by typing the device name does not bring up that file in the results. If a user loads all devices, then the search works fine with keywords