The Event Viewer is a Windows system tool that records system events, applications, and security information. It provides a detailed log of system activity, making it an invaluable tool for troubleshooting and diagnosing issues. By effectively utilizing the Event Viewer, you can quickly identify and resolve issues, improve system performance, and enhance overall system security. Some of the key Event Logs can be:
Application Log: Records events related to applications, including errors, warnings, and informational messages.
System Log: Records system-level events, such as hardware failures, driver issues, and operating system errors.
Security Log: Records security-related events, including login attempts, access failures, and security policy changes.
Setup Log: Records events related to software installation and uninstallation.
You can now collect Device Console logs from Scalefusion managed devices. These logs can be helpful in identifying the root cause if you are experiencing any issues like crashes, slow speed etc. and also in monitoring system performance.
This document describes how you can easily fetch event logs for managed Windows Devices through Scalefusion Dashboard.
Pre-requisites
Device should be enrolled with Scalefusion
You should be subscribed to Enterprise 2023 plan
You should have Scalefusion MDM Agent (agent app for Windows) v15.7.0 or higher
Steps to pull Event logs
On Scalefusion Dashboard, navigate to Devices section and select the Windows device for which you want to pull the logs.
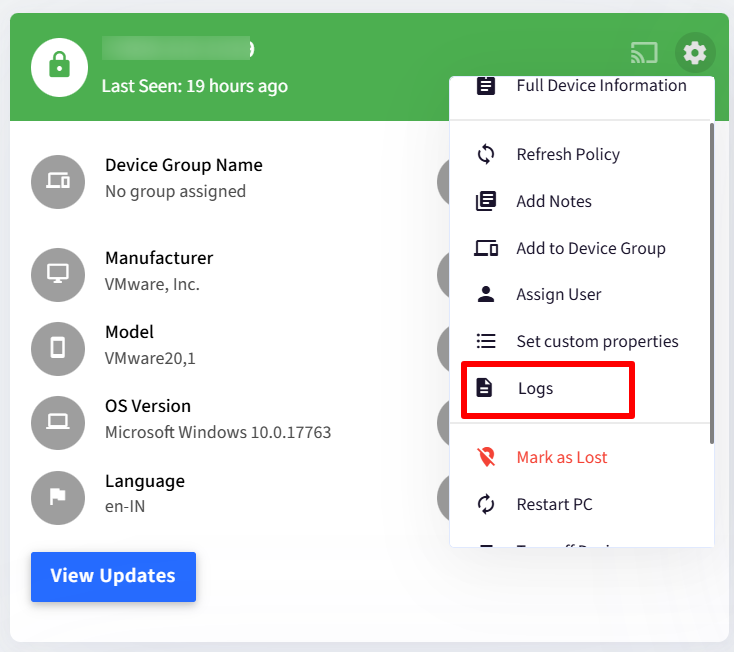
Click on Logs from the gear icon menu.
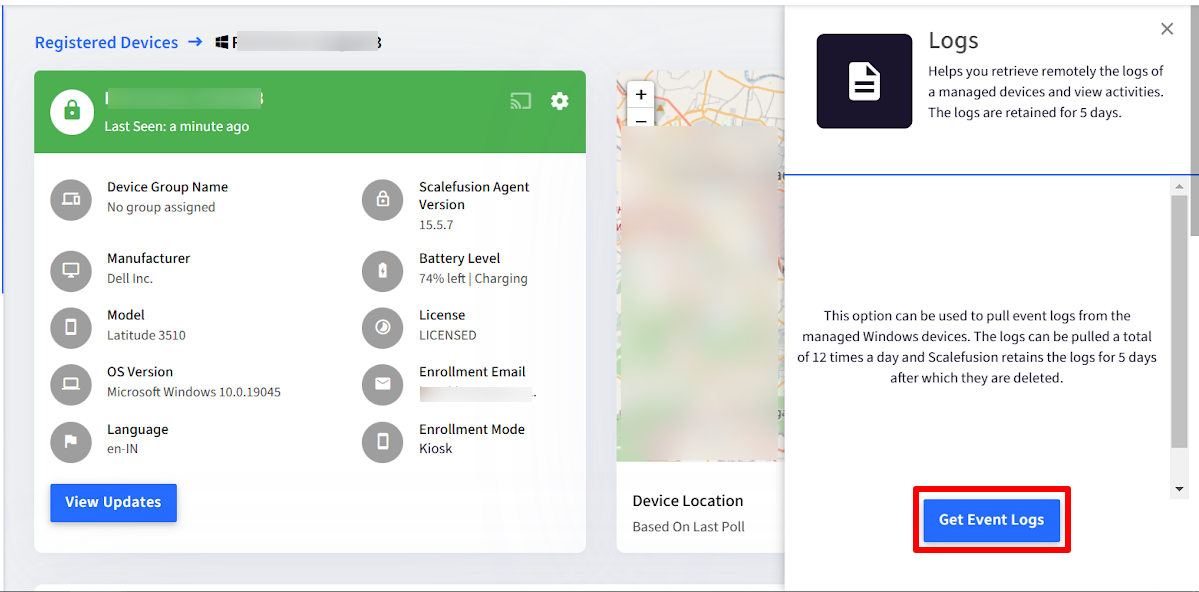
On the right side panel, click on the button Get Event Logs on the right side panel.
This opens the Get Event Logs wizard. In this select the following to filter the type of logs you want to fetch. After selecting click Next to go to next tab:
Event Log Filter: Under this, select any one of the following:
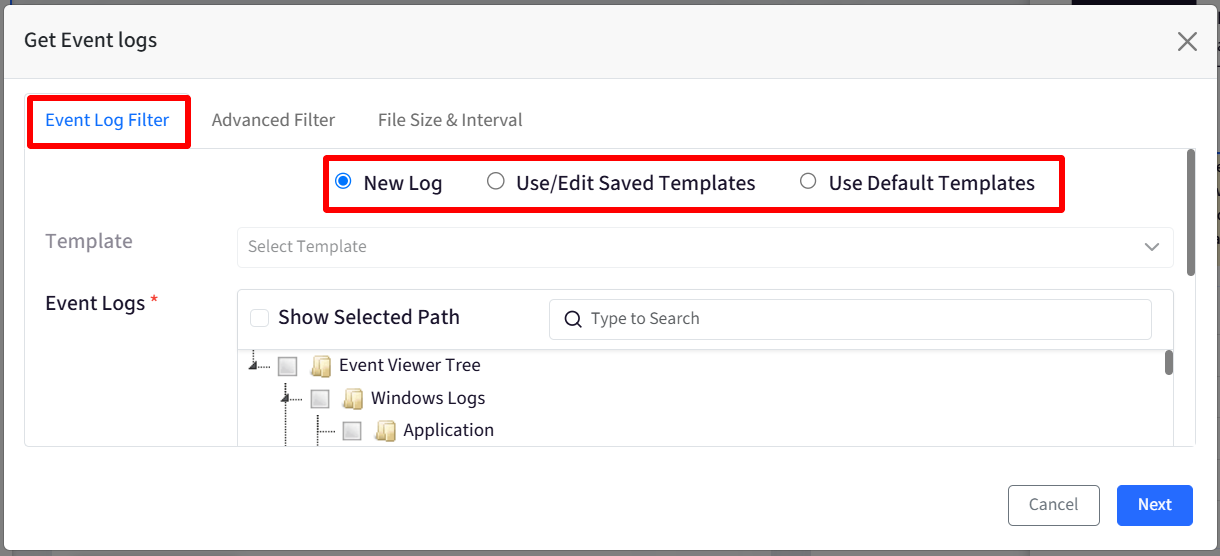
New Log: Select the event(s) from the event logs tree. You can use search to look for a specific event or select Show Selected Path to filter and highlight the event you have selected for which logs have to be fetched.
Use Saved Templates
Templates: This will list down all event log templates saved by the user. Select one template.
Event Logs: This will display the events (pre-selected) as per the selected template
Use Default Templates: Lists all the pre-defined templates. Select one from the list for which you want to fetch logs. Note: With this option, the Event logs tree structure will be greyed out so you cannot make any selections there.
Advanced Filter
This section provides information on the advanced filtering options available in the Event Log Wizard. These options allow you to refine your search results and identify specific events of interest. Advanced Filter Options:
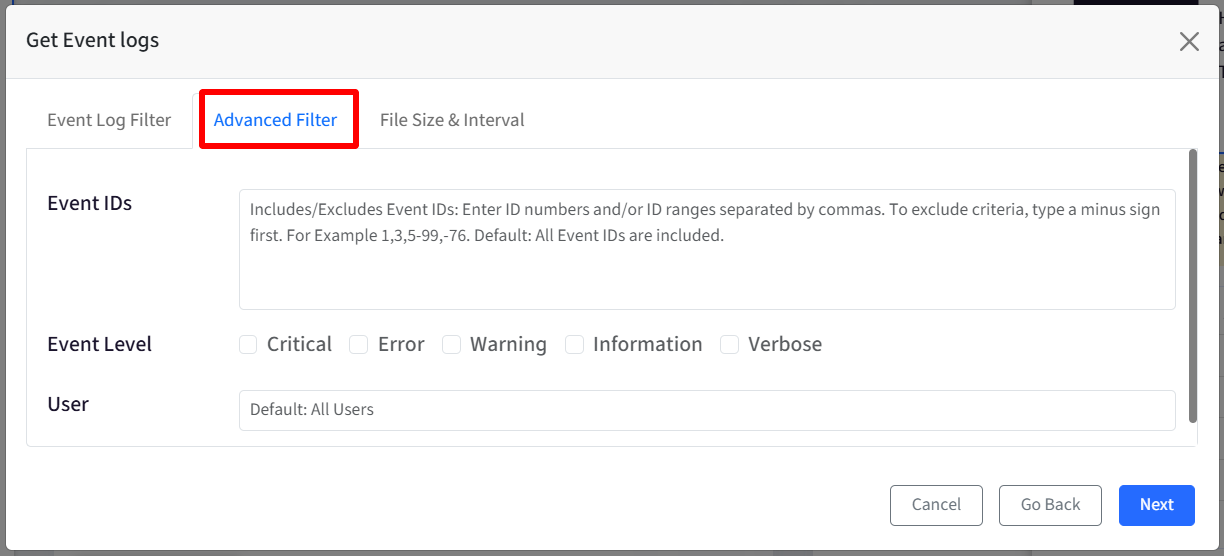
Event IDs: Enter a comma-separated list of event IDs or ID ranges to filter results. Use a minus sign (-) to exclude specific IDs. For Example: 1,3,5-99,-76 (includes IDs 1, 3, 5-99, but excludes ID 76)
Event Level: Select one or more event levels to filter results.
Options: Critical, Error, Warning, Information, Verbose
User: Filter events based on a specific user's actions.
File Size and Interval
This section provides information on the file size and interval settings for the Event Log Wizard. These settings allow you to control the size and retention period of event logs. File Size and Interval:
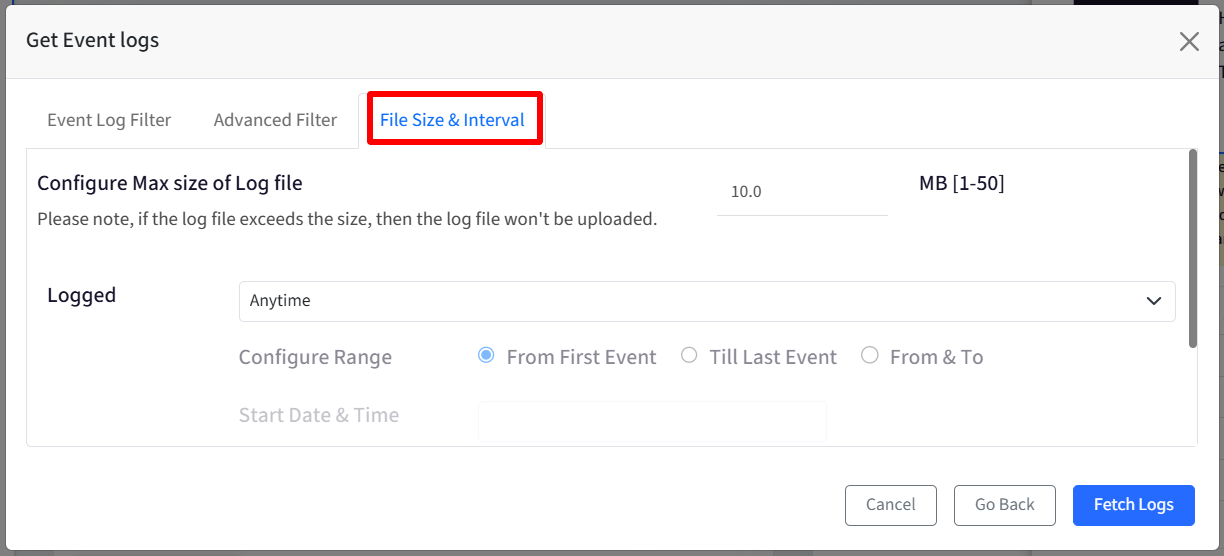
Configure Max size of Log File: Set the maximum size (in MB) of the log file. Once the file reaches this size, it will be compressed and uploaded. By default it is set to 10MB and you can set the size from 1 to 50MB
Logged Events:
Options:
Anytime (Default): Logs all events.
Last Hour: Logs events from the past hour.
Last 12 Hours: Logs events from the past 12 hours.
Last 24 Hours: Logs events from the past 24 hours.
Last 7 Days: Logs events from the past 7 days.
Last 30 Days: Logs events from the past 30 days.
Custom Range: Allows you to specify a custom date and time range. Custom Range:
From First Event: Logs events from the beginning of the specified date and time.
Till Last Event: Logs events up to the specified date and time.
From & To: Logs events within a specific date and time range.
Template Name: Optionally assign a name to the current filter settings. This allows you to save and reuse the filter configuration for future use.
After making all selections, click on Fetch Logs
Logs will be fetched as per configurations, and listed on Dashboard with current Status as Waiting along with other details.
Refresh the page once to download the log file. Note that the status will change to Download
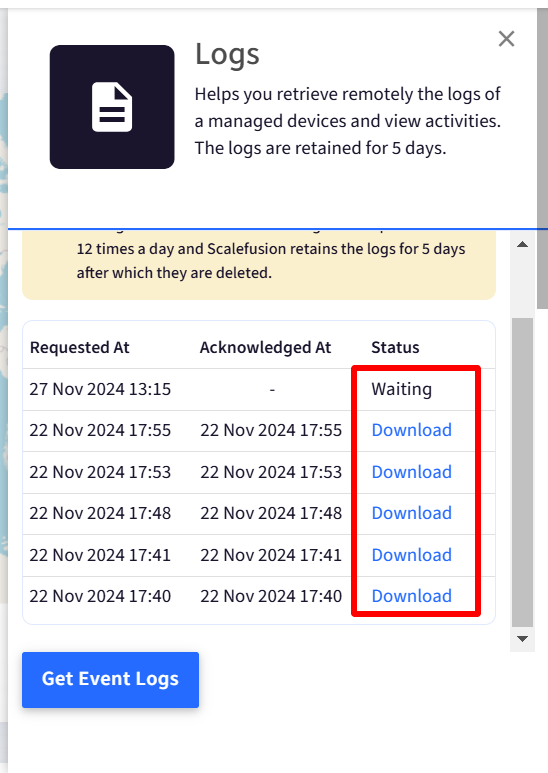
Log Fetching Status
Waiting: The initial state when a log fetch request is initiated.
Download: The log file has been successfully fetched and is ready to be downloaded.
Failed: The log fetch request failed due to various reasons, such as network issues, device inactivity, or user account issues.
Note: For failed log fetch requests, you can view detailed error logs in text format by clicking the Logs button next to the Failed status.
Timed Out: The log fetch request timed out before completion. This can occur if the device did not acknowledge the request within a specified timeframe.
Download Logs
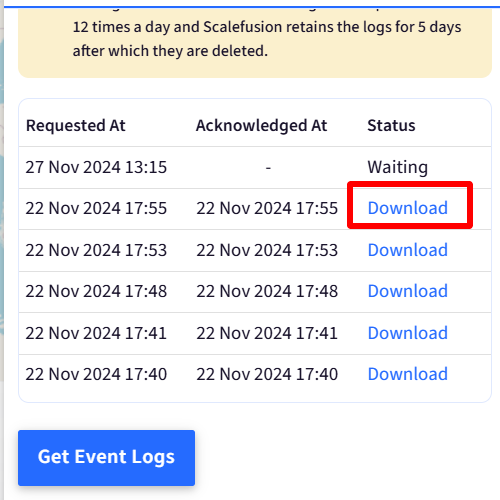
Once logs are fetched successfully, you should see Download under Status with which the logs can also be downloaded. The logs are downloaded in zip format. You need to unzip them to get the log file which is in .evtx format.
Important Points
Logs can be pulled from devices a maximum of 12 times per day.
The logs are retained for 5 days on the Dashboard and automatically deleted after that.
Log fetch activities are also recorded in the Account Activity Report for additional visibility and auditing purposes.