Introduction
In today’s complex IT environments, organizations rely heavily on Security Information and Event Management (SIEM) tools to maintain visibility, ensure compliance, and respond proactively to security threats. Splunk is a widely adopted data analytics and SIEM platform that enables businesses to collect, store, analyze, and visualize large volumes of machine-generated data from across their infrastructure.
Splunk Enterprise Security enhances this capability by providing actionable insights into potential threats, user behavior, and system anomalies—making it a critical component of many enterprise security strategies.
To support unified monitoring and centralized security operations, this document outlines the integration of Scalefusion with Splunk. As a Unified Endpoint Management (UEM) solution, Scalefusion has access to detailed device management data and user activity within the admin console. Integrating this data into Splunk allows you to view and analyze endpoint management events alongside other enterprise security logs, providing a single-pane-of-glass view across the organization’s infrastructure.
This integration aims to enhance operational visibility, support compliance reporting, and strengthen security posture by correlating device activity with broader organizational events.
Pre-requisites
You must have access to the Splunk admin console, including the necessary server details.
Integrating Splunk with Scalefusion
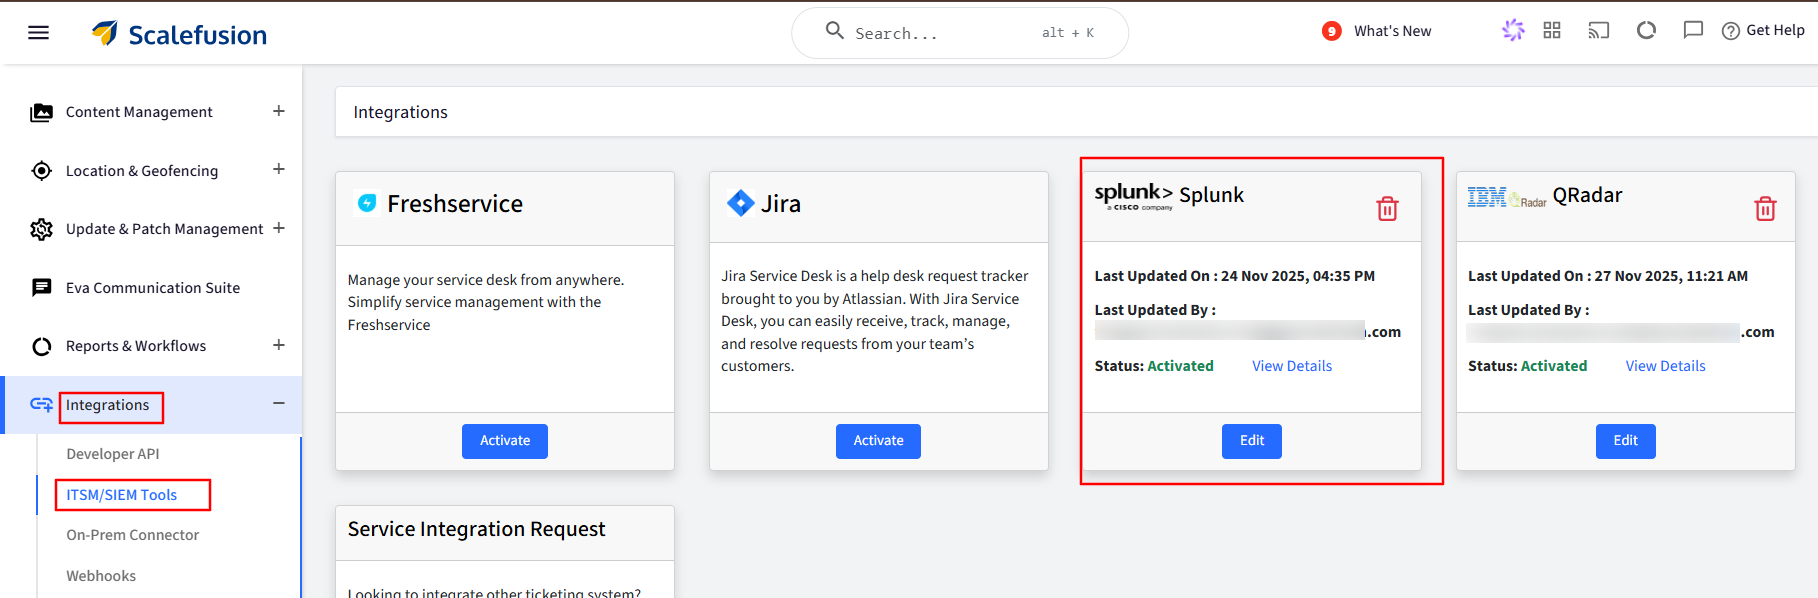
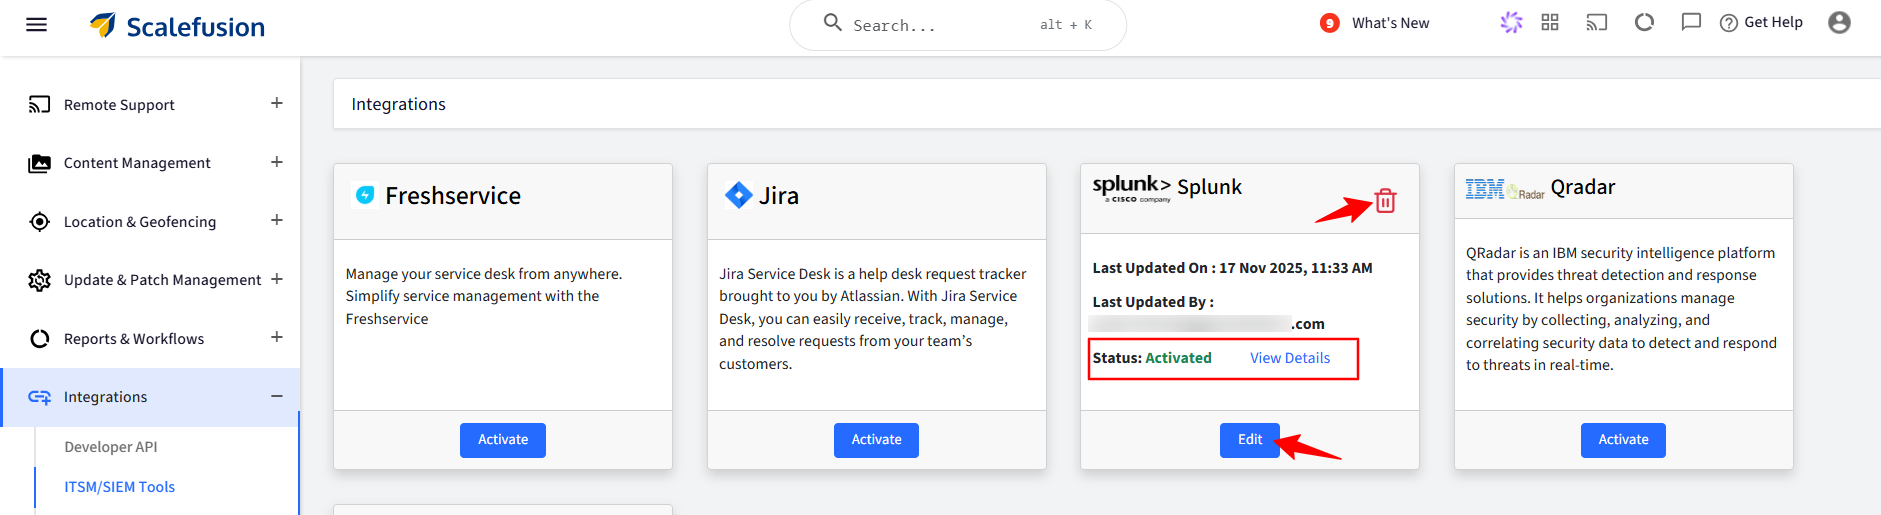
On the Scalefusion dashboard, navigate to Integrations > ITSM/SIEM Tools.
Here, click Activate for Splunk.
Server Details
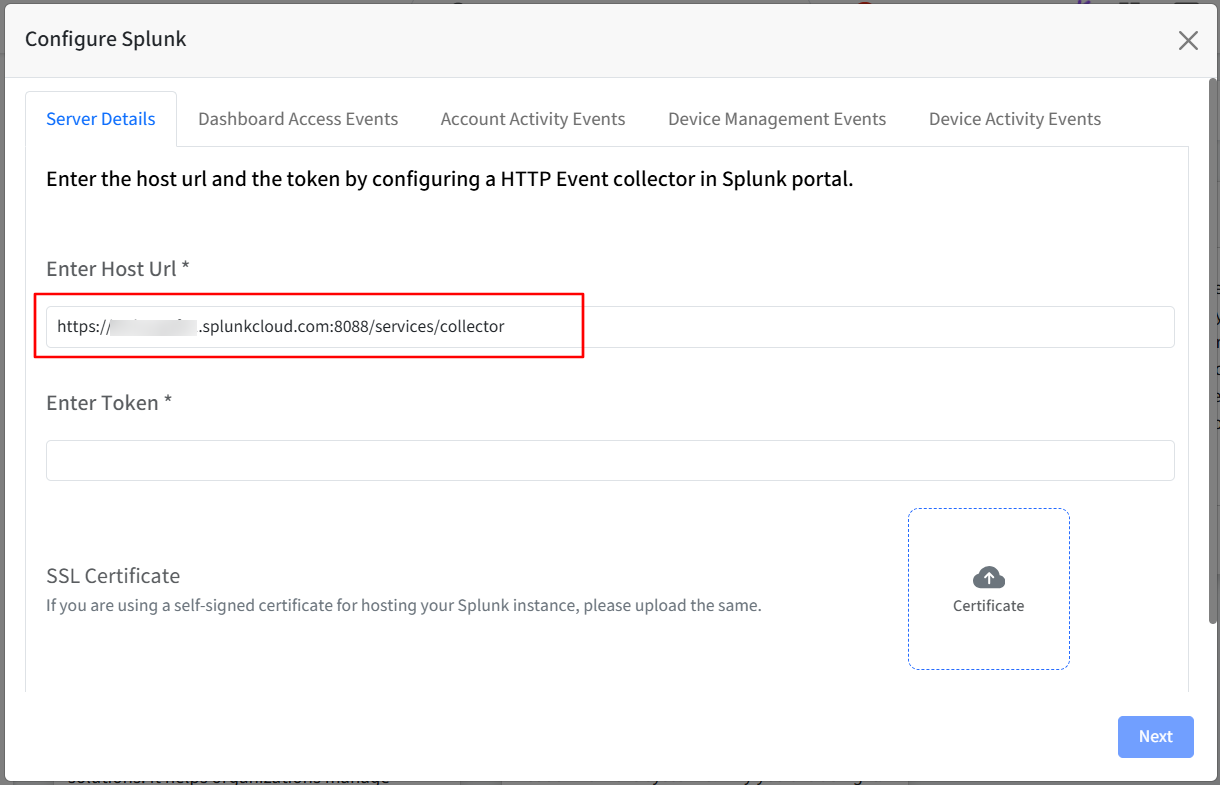
Enter the host URL and the token by configuring an HTTP Event Collector in the Splunk portal.
You will find the host URL in your Splunk portal.
The token will be generated once you configure the HTTP Event Collector.
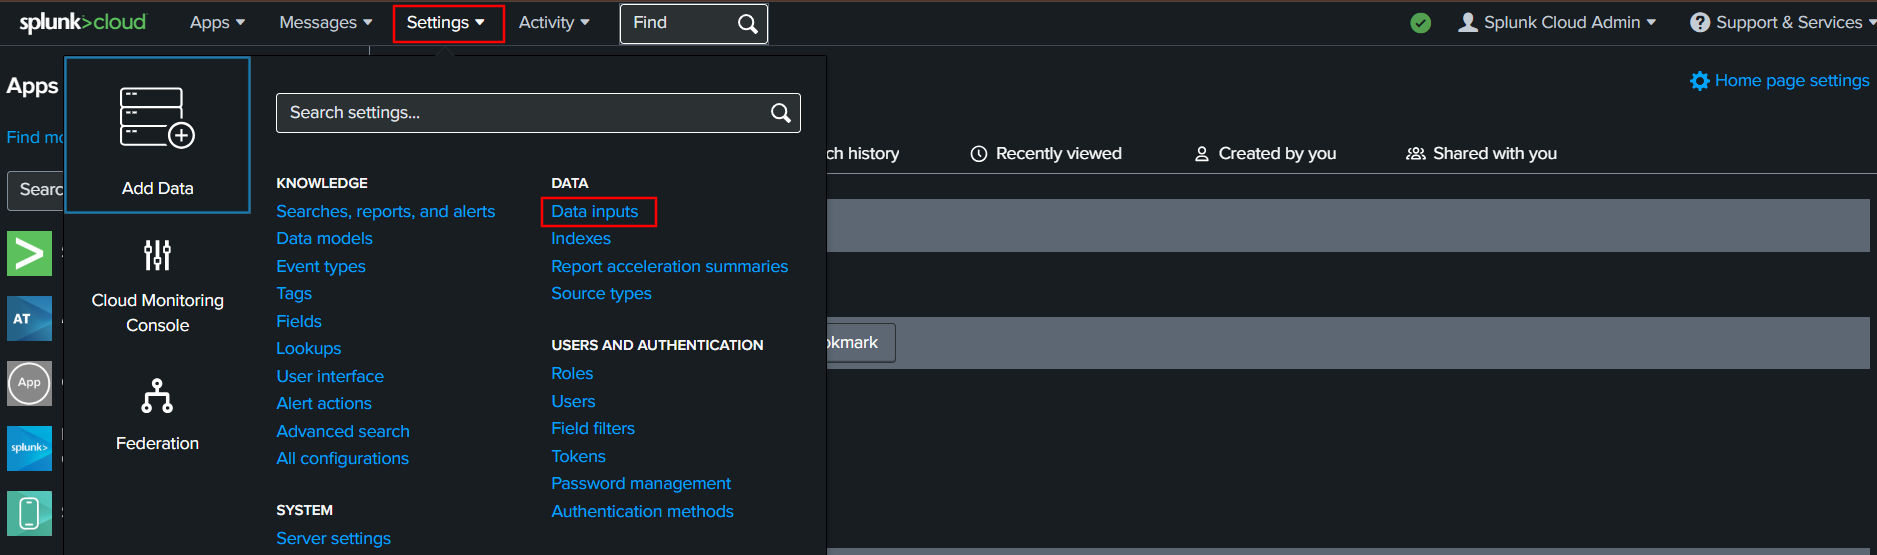
Log in to your Splunk portal and go to Settings > Data Inputs.
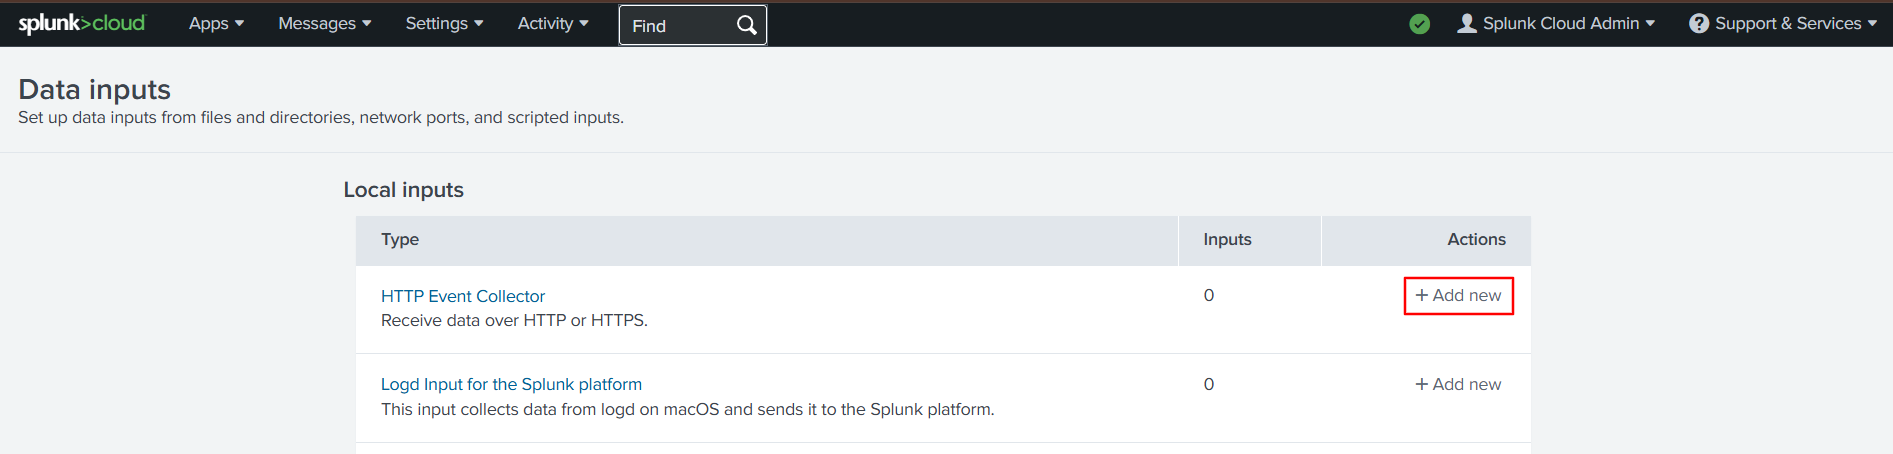
Click Add New under Actions next to HTTP Event Collector.
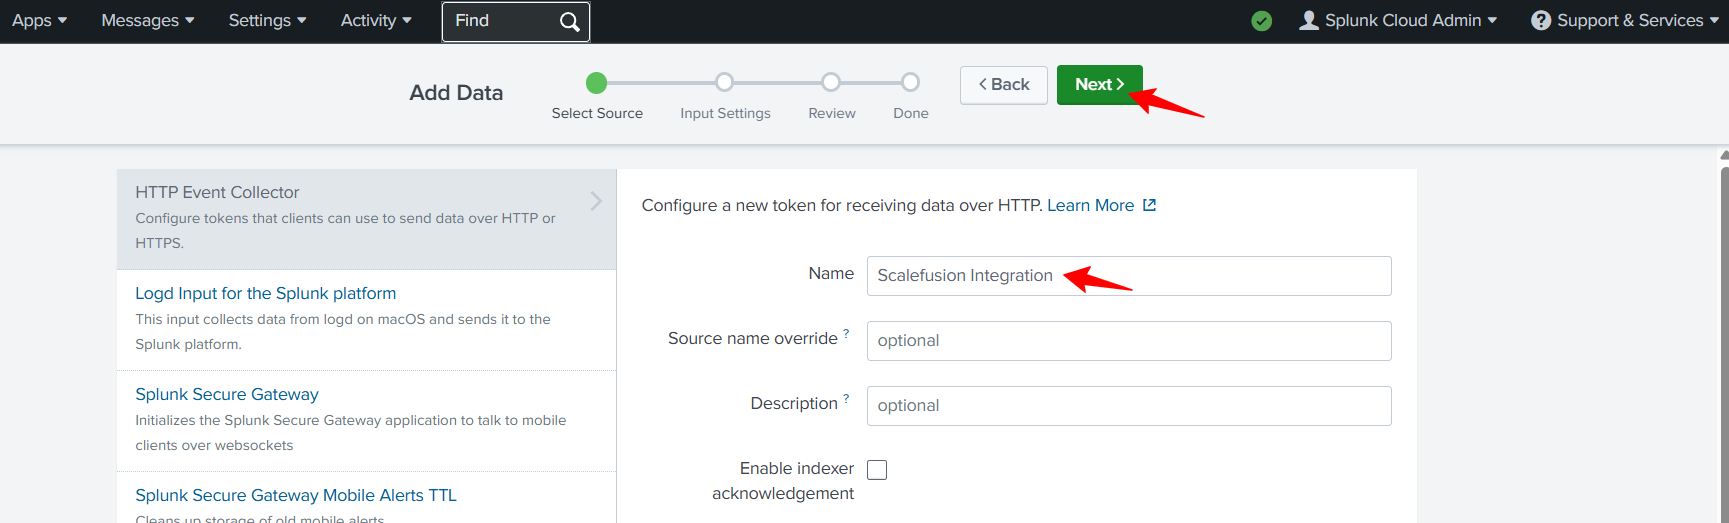
Provide a name and click on Next.
Keep the Source Type as Automatic.
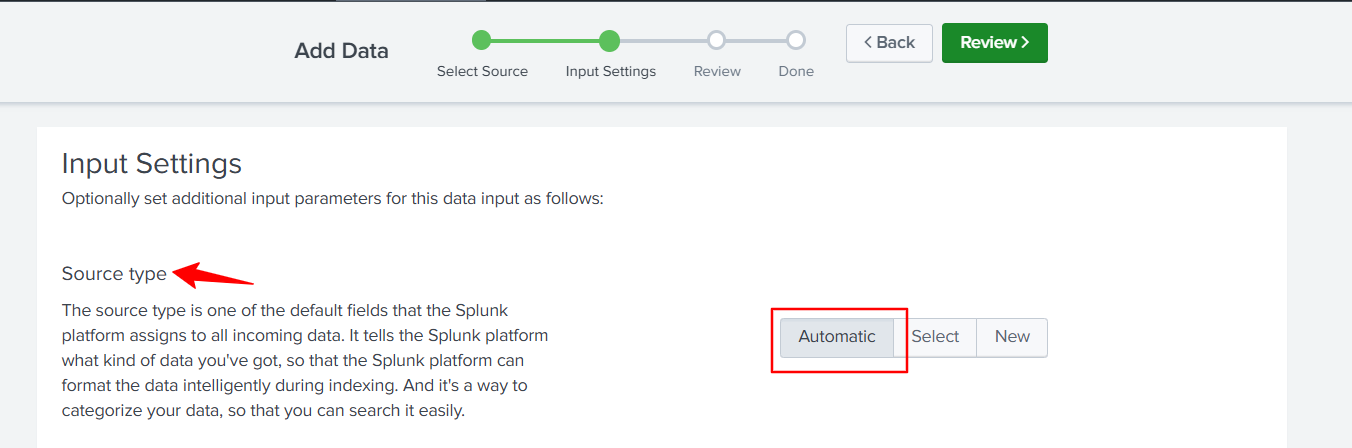
Select the Index Items to be allowed by clicking on the available items.
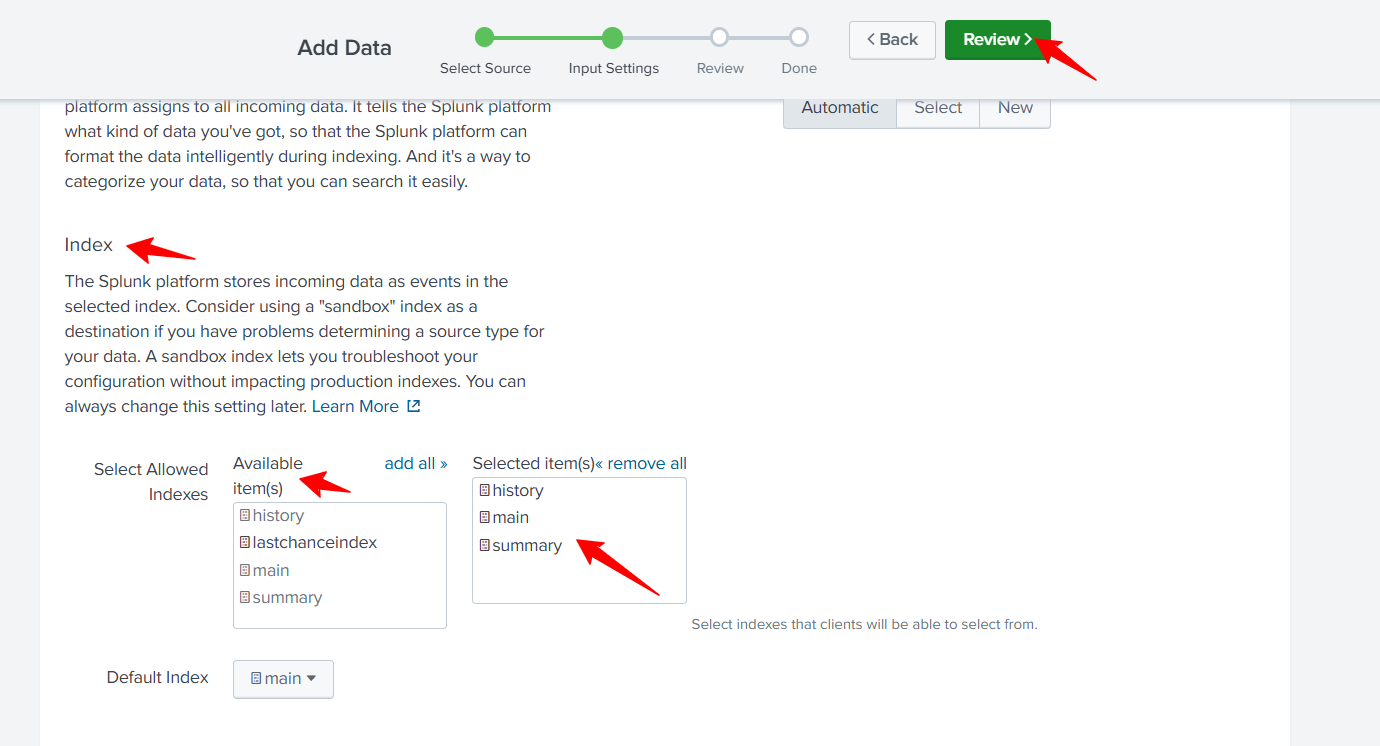
Click Review.
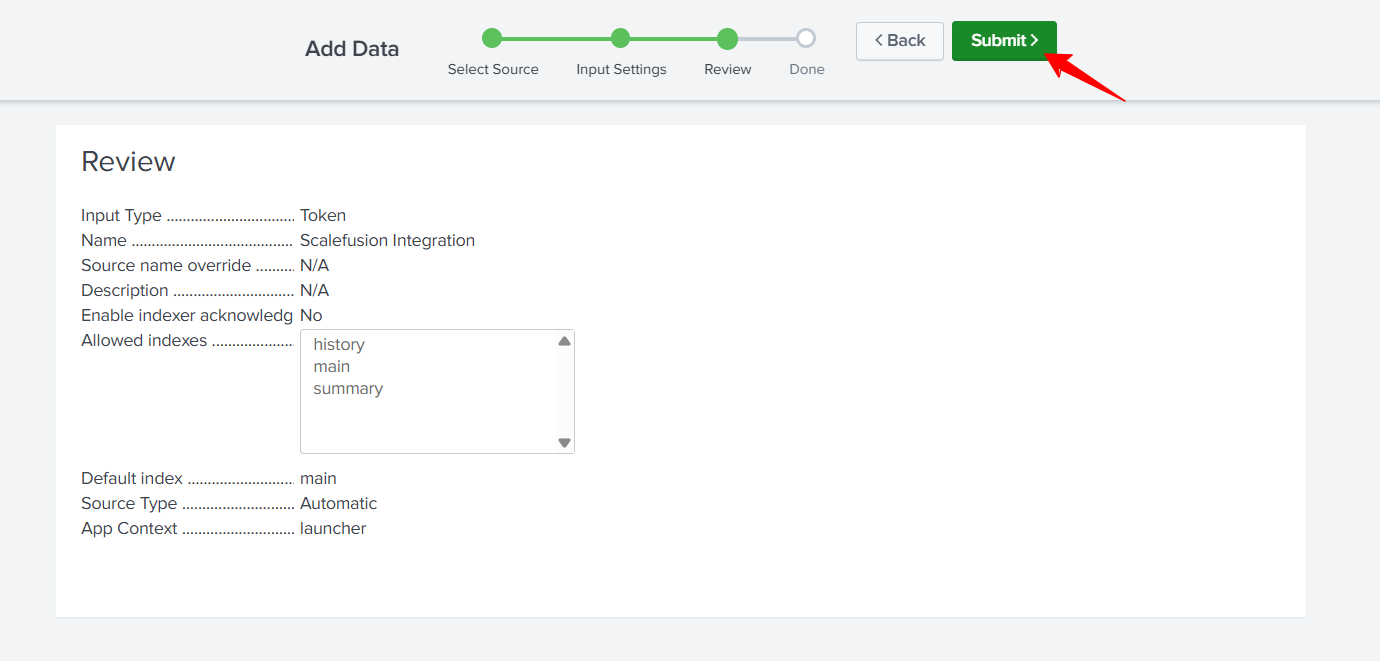
Review and click Submit.
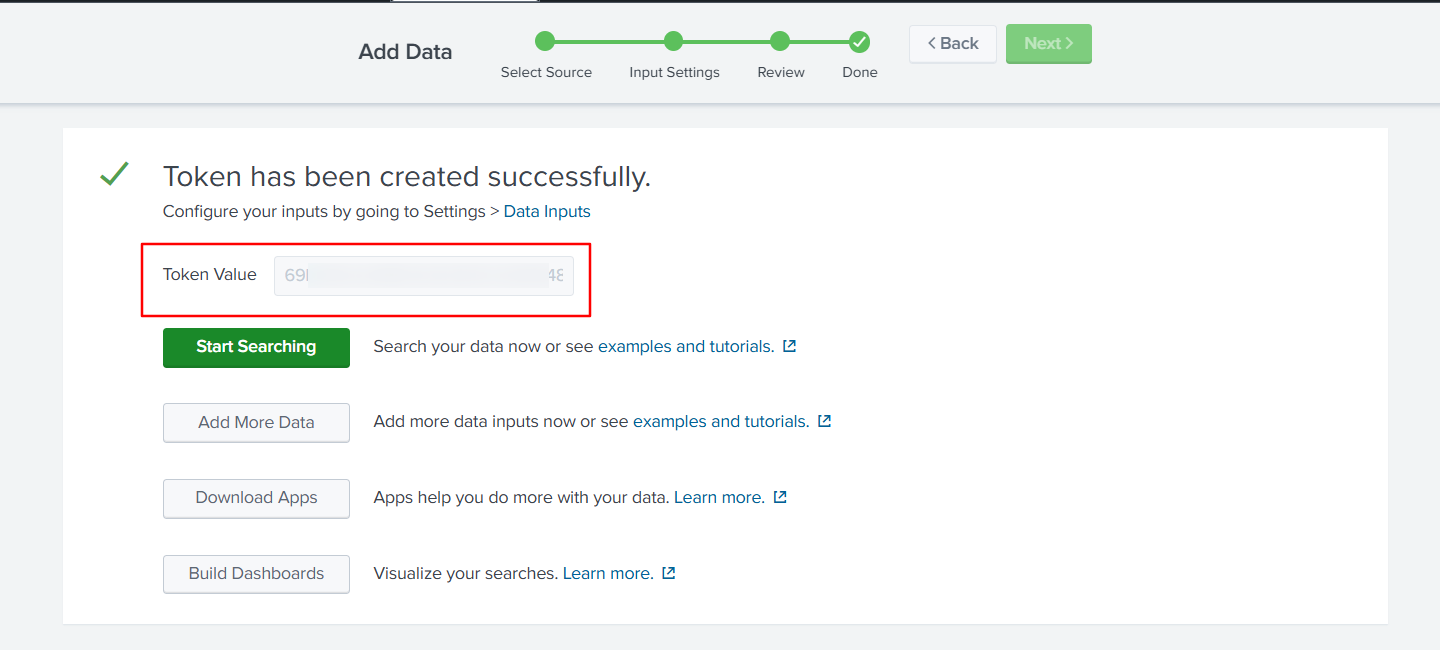
Copy the token and add it to the Server Details in the Scalefusion dashboard.
On the Scalefusion dashboard, enter the Host URL and Token.
The SSL Certificate is optional. However, if you are using a self-signed certificate for hosting your Splunk instance, please upload the same and click Next to go to the Dashboard Access Events tab.
When configuring the Host URL for Splunk Cloud services, ensure the following suffix is appended:
:8088/services/collectorFor self-hosted Splunk deployments, this suffix is not required in the Host URL.
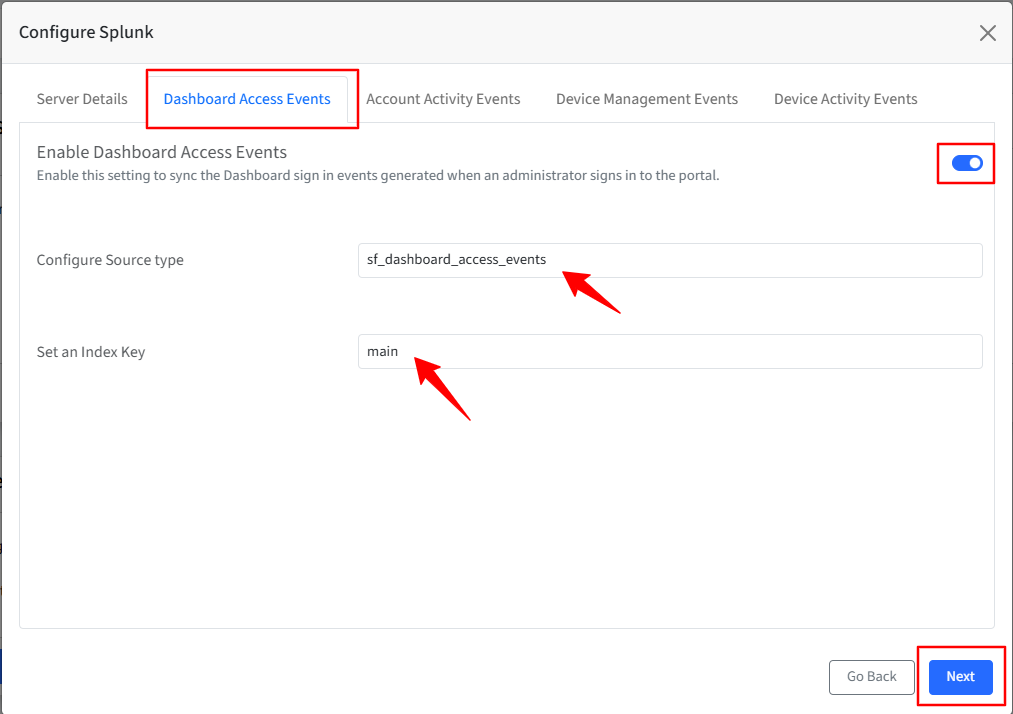
Dashboard Access Events
Turn on the toggle to sync the Dashboard sign-in events generated when an administrator signs in to the portal.
The Configure Source Type is auto-populated.
Set an Index key based on the Index Items you have selected in the Splunk portal—for example, main, history, or summary.
Click Next.
The following synced events will be displayed in the Splunk portal.
{
"topic/slug/source": "as configured in dashboard : example: dashboard_access_events",
"event": {
"useremail": Email of the Admin trying to perform activity
"username": Name of the Admin trying to to perform activity
"source_ip": The IP from which they tried to to perform activity
"timestamp": The time in UTC at which this was peformed
"activity": user_login or user_logout or password_change or admin_and_roles
"activity_result": Success or Failed
"activity_event_meta"
"user_login_success"
"password_updated"
"password_change_request"
"user_login_fail_username"
"user_login_fail_password"
"user_login_otp_fail"
"user_logout"
"user_login_fail_expired_creds"
"admin_added_success"
"adming_deleted_success"
"role_updated"
"admin_name": Null or a value if the activity is if type admin_and_roles
"admin_email": Null or a value if the activity is if type admin_and_roles
"message":
"Successful user login"
"Invalid user"
"Invalid credentials"
"Invalid OTP login attempt"
"Expired user account attempted login"
"Password change request initiated"
"Password changed successfully"
"Admin added successfully"
"Admin deleted successfully"
"Admin updated successfully"
}
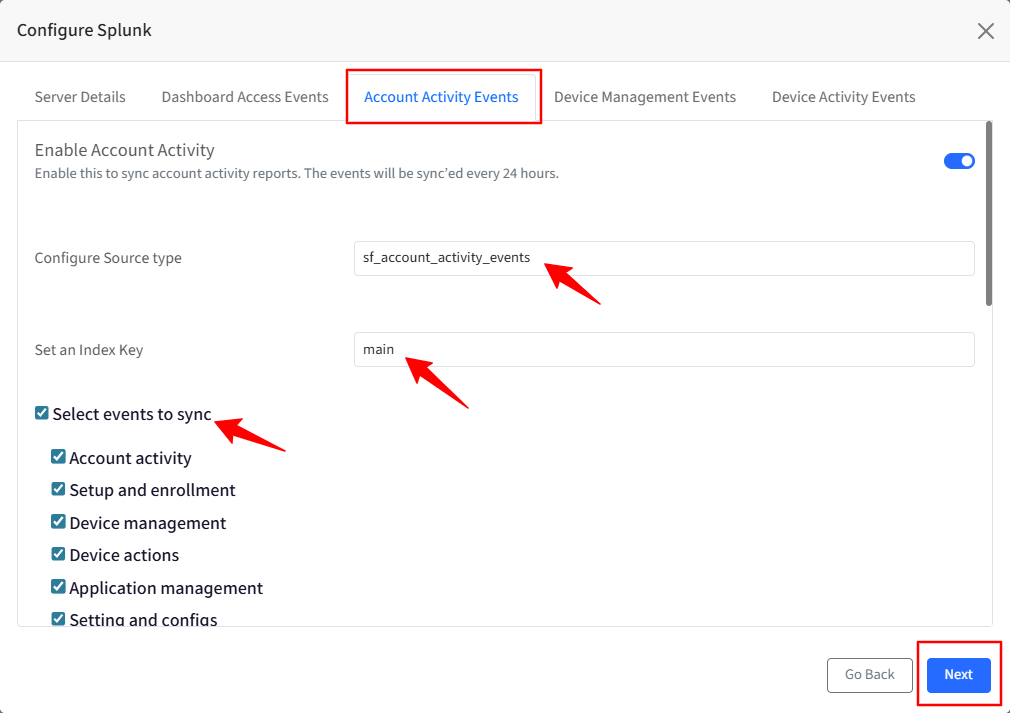
}Account Activity Events
Turn on the toggle to sync the Account Activity events generated as per the account activity reports.
The Configure Source Type is auto-populated.
Set an Index key based on the Index Items you have selected in the Splunk portal—for example, main, history, or summary.
Select an event(s) that you would like to sync to your Splunk portal.
Click Next.
The following synced events will be displayed in the Splunk portal.
{
"topic/slug/source": as configured in Dashboard
"events": [
{
"username": The name of the user who performed the activity
"useremail": The email of the user who performed the activity
"category": The category to which the action belongs to
"activity": The short description of the activity that was performed
"message": The message that is shown in account activity
"source_ip": The IP from which the request was performed
"timestamp": The time at which the action was performed in UTC format
"impact": The count of devices it has impact on or N/A
"queued_for_approval": true if this event was queued for approval, false if it was approved or changed
}
]
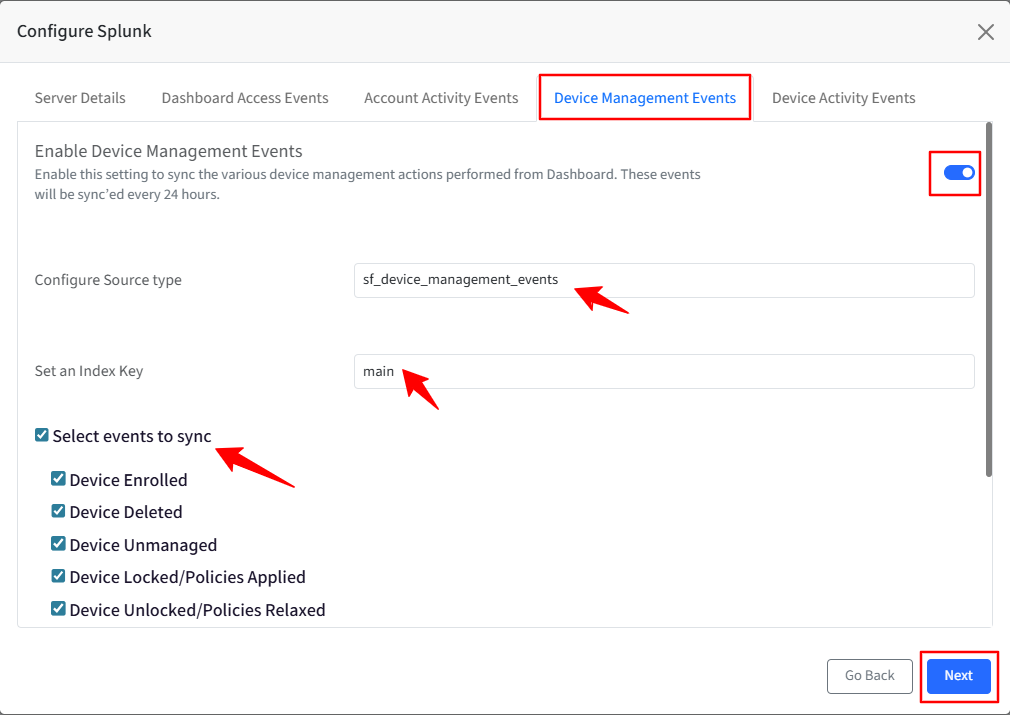
}Device Management Events
Turn on the toggle to sync the Enable Device Management events to sync the various device management actions performed on the Dashboard.
The Configure Source Type is auto-populated.
Set an Index key based on the Index Items you have selected in the Splunk portal—for example, main, history, or summary.
Select an event(s) that you would like to sync to your Splunk portal.
Click Next.
The following synced events will be displayed in the Splunk portal.
{
topic/slug":as configured in Dashboard for example device_management_events
"event": one of the below
"device_enrolled"
"device_deleted"
"device_unamanaged"
"device_locked_policies_applied"
"device_unlocked_policies_relaxed"
"device_marked_as_lost"
"device_marked_as_found"
"factory_reset_device"
"device_shutdown"
"device_reboot"
"device_policy_updated"
"username": The name of the Admin
"useremail": The email of the Admin
"source_ip": The IP which originated this action
"timestamp": As per UTC
"device_id": Scalefusion Device ID
android_id:
app_version_name: 17.6.0-IC
avbl_wifi_ssids: [
Tata -5GHz,00:
PxxxxxManage,04:
Pxxxxx_5GHz,00:
]
battery_charging: null
battery_status: 45
battery_temp_in_celsius: 31
benchmark_details: {
benchmark: null
compliance_percentage: 30.3
compliance_status: N
mode: null
policy_group: null
variant: null
}
bluetooth_mac: null
build_serial_no:
charging: null
connected_wifi_mac_address:
connected_wifi_ssid: Pxxxxx
cpu_temp_in_celsius: 52.65
cpu_usage: null
custom_properties: [
{
data_type: String
name: mode
value: null
}
]
d_build_version:
data_roaming_enabled: false
data_roaming_enabled_2: false
device_generated_bypass_code: null
device_group: {
id: null
name: null
parent_group_id: null
}
device_profile: {
id: null
name: null
}
enrollment_date: 2025-07-23 14:21:12 UTC
enrollment_method: 6-times tap
exit_password: 2323
firewall_enabled: -1
gsm_serial_no: unknown
gsuite_account: N/A
iccid_no:
iccid_no_2:
id:
imei_no:
imei_no_2: null
imsi_no: 9
imsi_no_2:
in_trial: true
ip_address:
last_connected_at: 2025-07-23 14:30:58 UTC
licence_active: true
licence_expires_at: 1787011200
licence_name: test
license: {
code:
expire_date: 2026-08-18
}
location: {
address: India
created_at: 2025-07-23 14:29:34 UTC
date_time: 1753280974449
lat:
lng:
}
locked: true
make: Google
marked_as_lost: null
mdm_generated_bypass_code: null
model: Pixel 4a
name:
os_version: 13
phone_no:
phone_no_2:
power_status: null
ram_usage: 0
rooted: no
screen_temp_in_celsius: 35.95
serial_no:
sim1_network_type: null
sim2_network_type: null
sim_network: null
sim_network_2: null
sim_signal_strength: null
sim_signal_strength_2: null
status: LICENSED
storage_info: {
bitlocker_passwords: {
}
total_external_storage: null
total_external_storage_avbl: null
total_internal_storage: null
total_internal_storage_avbl: null
}
total_ram_size: 5603
udid: null
unique_id:
voice_roaming_enabled: false
voice_roaming_enabled_2: false
wifi_mac_address: null
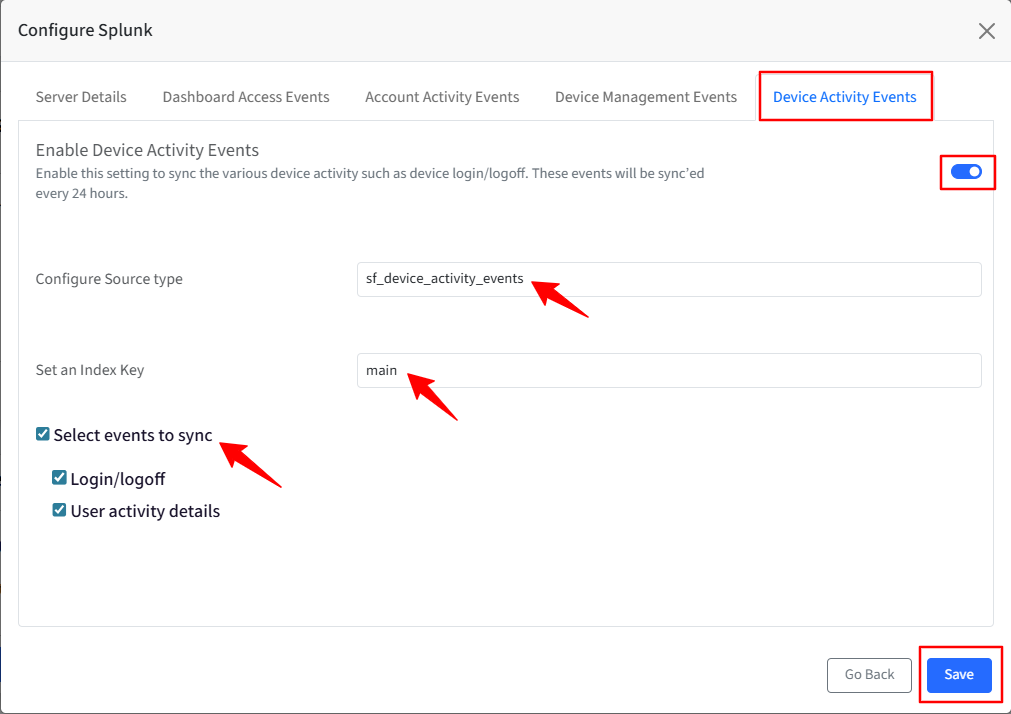
}Device Activity Events
Turn on the toggle to sync the device activity events, such as device login/logoff.
The Configure Source Type is auto-populated.
Set an Index key based on the Index Items you have selected in the Splunk portal—for example, main, history, or summary.
Select an event(s) that you would like to sync to your Splunk portal.
Click Save.
The following synced events will be displayed in the Splunk portal.
{
  "slug": "device_activity_events",
  "event": "value",
  "duration_in_mins": gives duration,
  "location": "N/A",
  "device_id": gives device id,
  "user_name": "Account name of the user",
  "device_name": "name of the device",
  "activity_type": "user_activity_details",
  "event_end_time": "the time at which event ends",
  "event_start_time": "the time at which event starts"
}
Viewing Details in the Scalefusion dashboard
After the setup is complete, the status and details will be visible on the Scalefusion dashboard. You will also have the option to modify the configuration if needed, or delete it entirely.
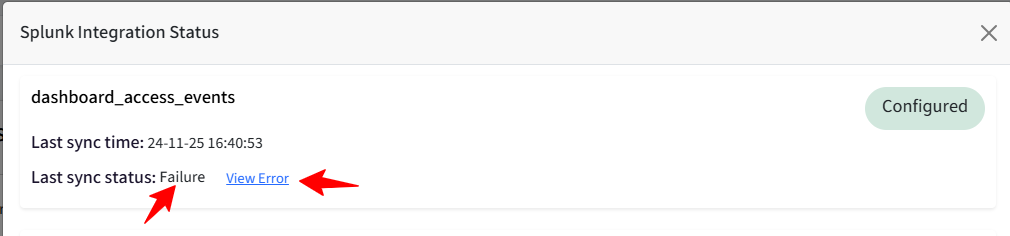
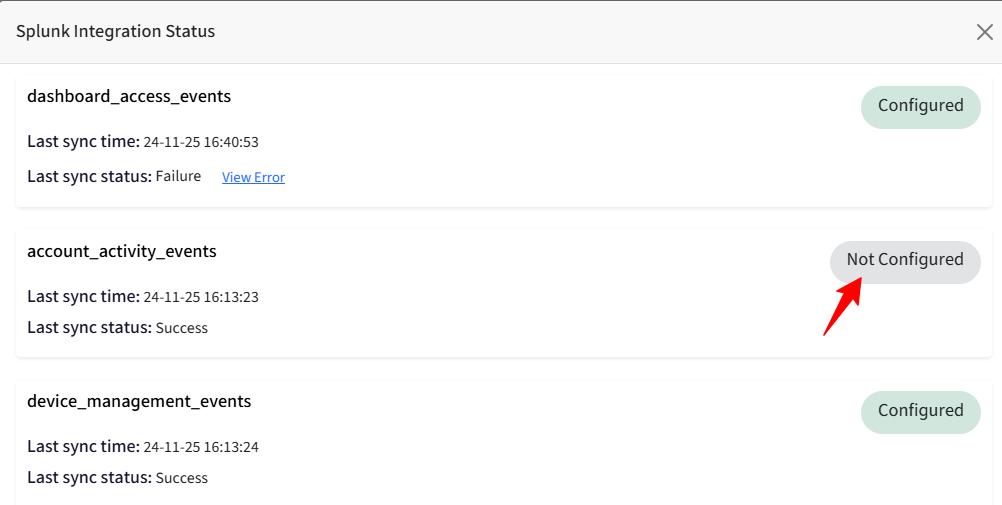
If an Event is synced successfully, the Last Sync Status in the View Details card will show as Configured.
If a sync issue occurs, it will be indicated as 'Failure' on the View Details card. You can click 'View Error' to see the specific reason for the failure.
Scalefusion will attempt to sync an event up to 10 times. If it remains unsuccessful, manual reactivation of the event will be required.
If any Event is not configured in the setup, it will show the status as Not Configured, and that event will not be synced with the Splunk portal.
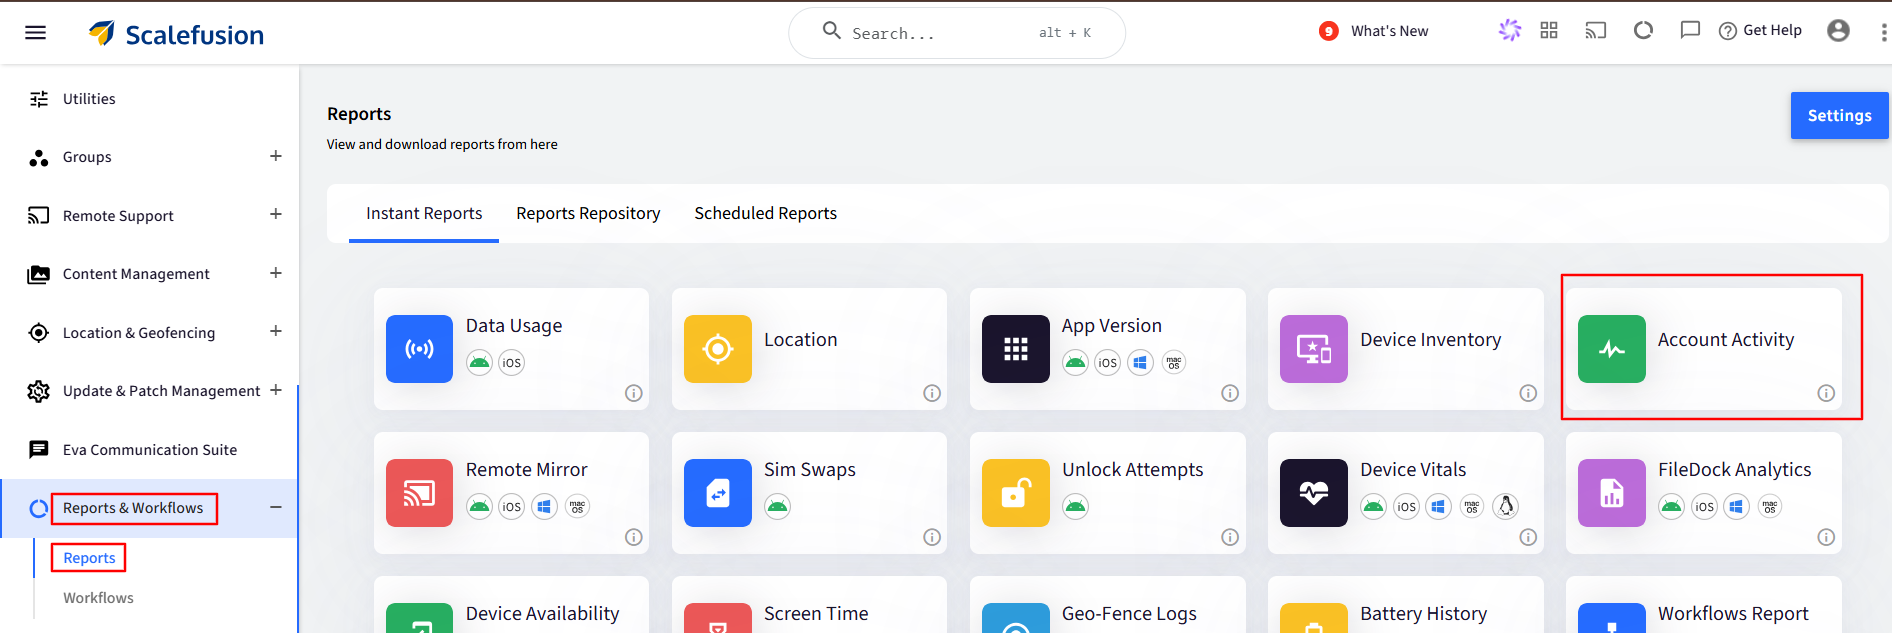
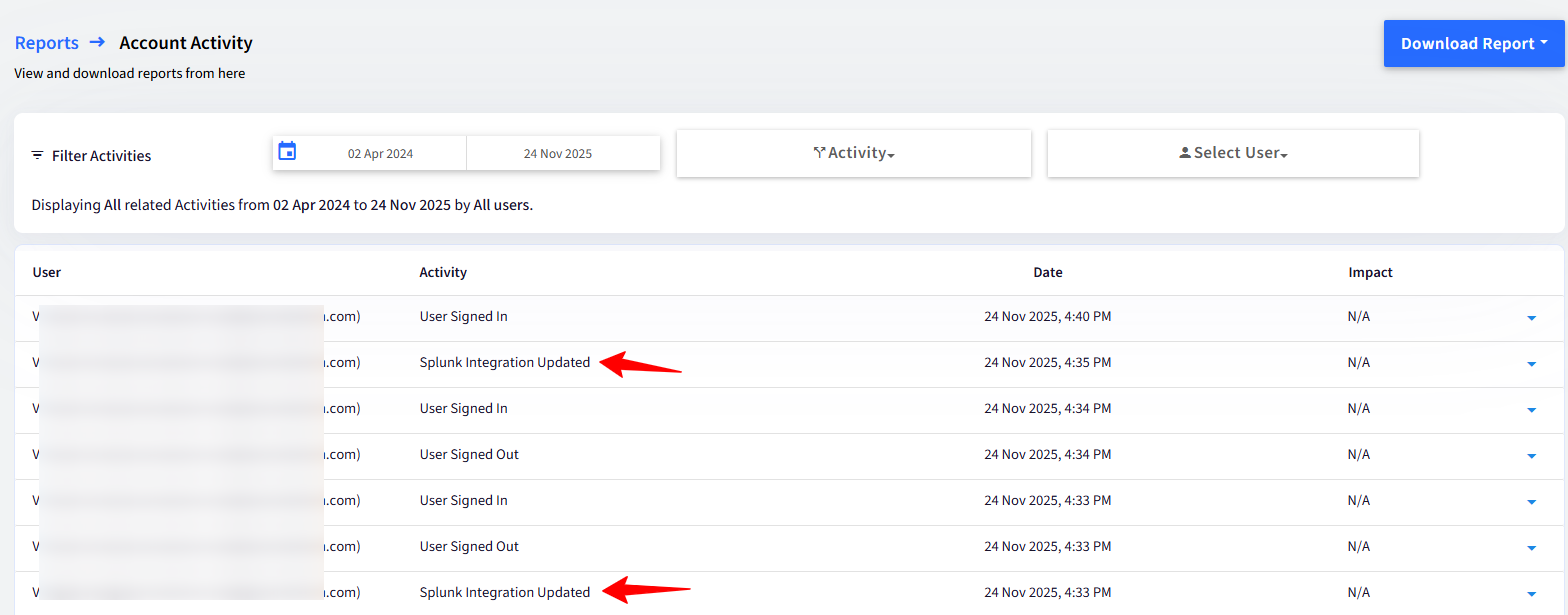
You will also be able to see the activities in the Account Activity report. Navigate to Reports & Workflows > Reports > Account Activity.
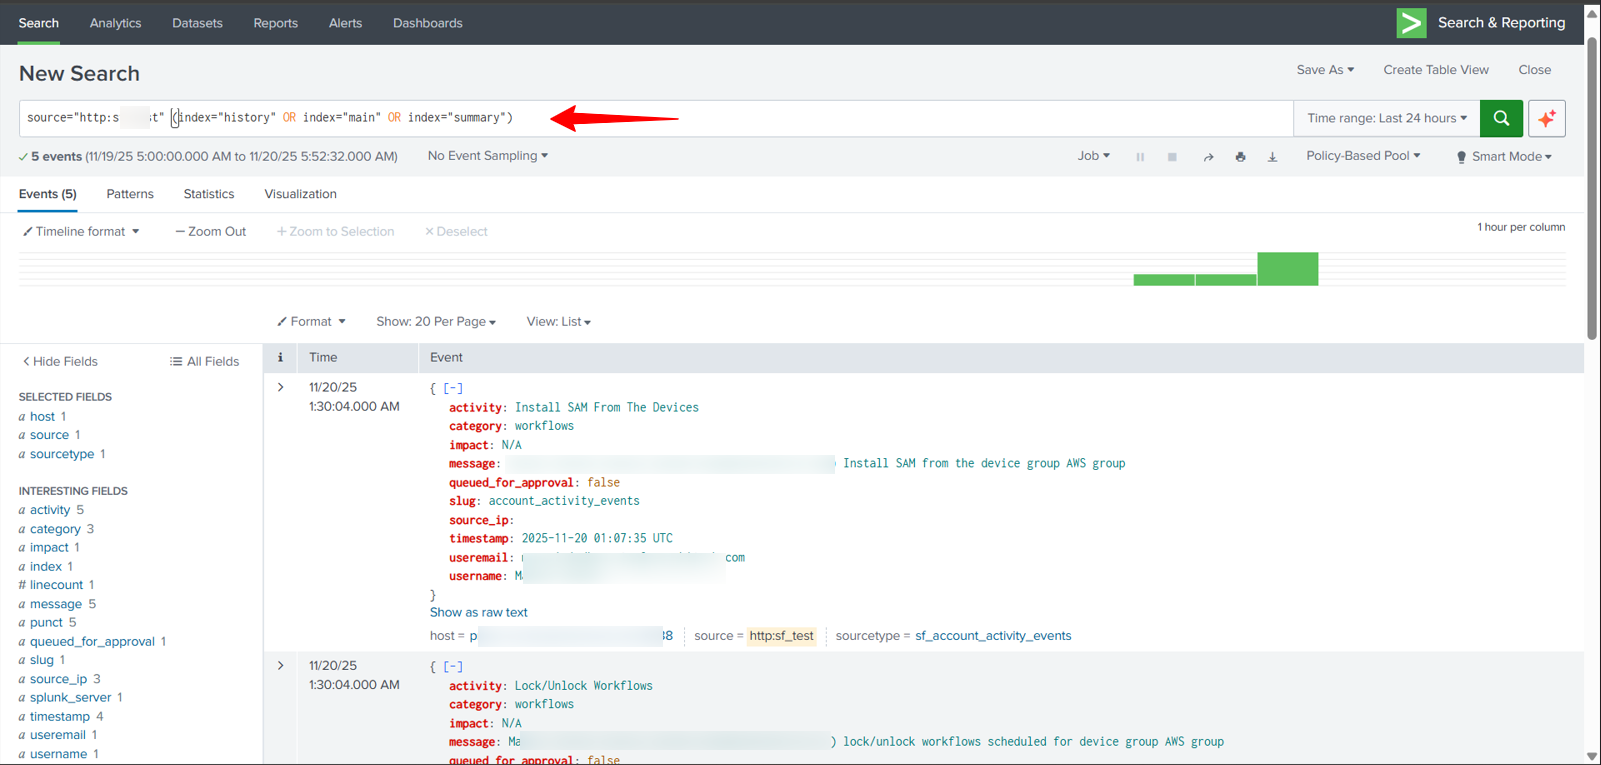
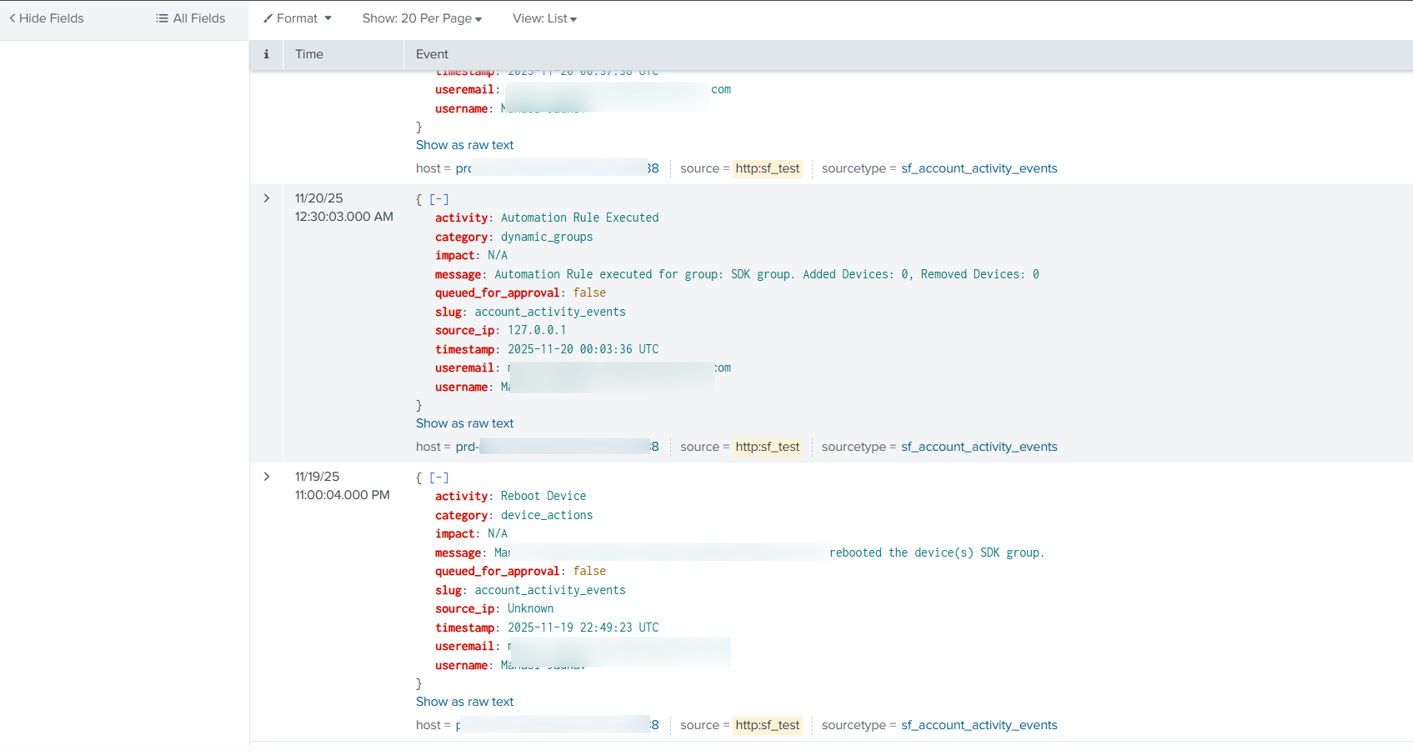
Viewing Events in Splunk portal
You’ll be able to view the reports in the Search section of the Splunk portal.
FAQ
Question:
What is the source IP address or URL from which Scalefusion sends data to Splunk Integrations?
Answer:
Scalefusion uses region-specific servers to send integration data to Splunk. You must allowlist the appropriate IP address based on your Scalefusion instance region.
Region | Instance URL | IP Address |
|---|---|---|
Global (EU) | app.scalefusion.com | 165.22.203.134 |
India | in.scalefusion.com | 3.108.153.5 |
MEA | mea.scalefusion.com | 51.112.212.140 |
US | endpointlockdown.com | 157.230.176.102 |
Important Notes:
Ensure that both inbound and outbound firewall rules allow traffic from the relevant IP address.
IP addresses are subject to change without prior notice. It is recommended to periodically review and update allowlists as needed.